
Prometheus普罗米修斯,搭建和使用
1.1 prometheus监控框架工具介绍
prometheus是由谷歌研发的一款开源的监控软件,它通过安装在远程机器上的exporter,通过HTTP协议从远程的机器收集数据并存储在本地的时序数据库上
同时Prometheus后端用 golang语言开发,前端是 Grafana
1.2 支持类型
Prometheus为了支持各种中间件以及第三方的监控提供了exporter,大家可以把它理解成监控适配器,将不同指标类型和格式的数据统一转化为Prometheus能够识别的指标类型。
例如Node exporter主要通过读取Linux的/proc以及/sys目录下的系统文件获取操作系统运行状态,reids exporter通过Reids命令行获取指标,mysql exporter通过读取数据库监控表获取MySQL的性能数据。他们将这些异构的数据转化为标准的Prometheus格式,并提供HTTP查询接口。
Prometheus的流行和Kubernetes密不可分,支持对Kubernetes、容器、OpenStack的监控。
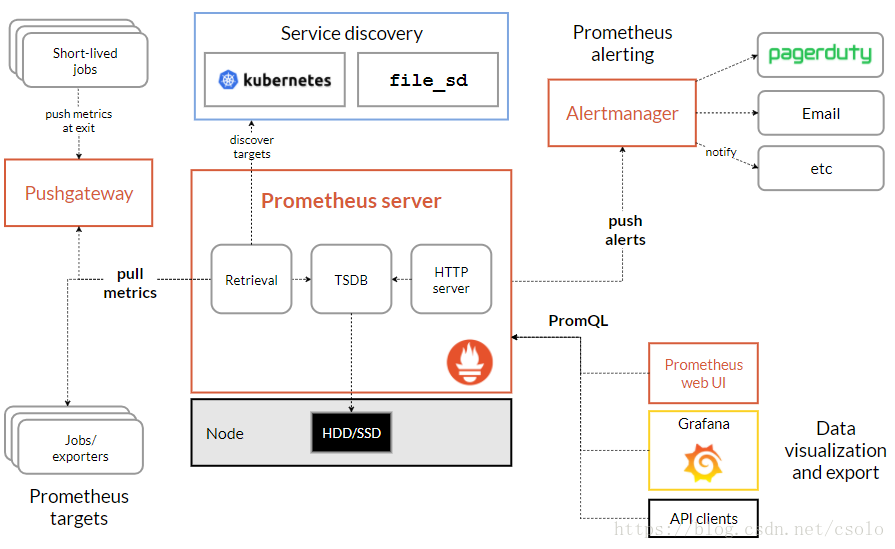
上图可以看出常用的组件主要有:
Prometheus server端:是Prometheus组件的核心,主要是对监控数据的获取,存储以及查询。
Exporter:获取监控组件的数据,并推送给Prometheus server端。
Alertmanager:告警处理组件。对告警规则产生告警信息进行处理,如:分组、抑制、静默等。
Pushgateway:主要用于瞬时任务的场景,Pushgateway可以获取监控数据并存储,Prometheus server端定时拉取。
WebUI:可视化界面管理,用户可以通过界面获取Prometheus的当前配置,监控任务运行状态等。常用的有:Grafana。
Service Discovery:服务发现。用户通过服务发现和注册的工具对成百上千的节点进行服务注册,并最终将注册中心的地址配置在Prometheus的配置文件中,大大简化了配置文件的复杂程度,也可以更好的管理各种服务。常用的有DNS、consul等
2. Prometheus 源码安装和启动配置
普罗米修斯下载网址:https://prometheus.io/download/ 或者使用清华源
监控集成器下载地址:http://www.coderdocument.com/docs/prometheus/v2.14/instrumenting/exporters_and_integrations.html
useradd -M -s /sbin/nologin prometheus
wget https://github.com/prometheus/prometheus/releases/download/v2.45.6/prometheus-2.45.6.linux-amd64.tar.gz
tar xf  prometheus-2.45.6.linux-amd64.tar.gz -C /usr/local
mv prometheus-2.45.6.linux-amd64/ prometheus
chown -R prometheus.prometheus /usr/local/prometheus
查看版本号
[root@VM_2-45 /usr/local/prometheus]# ./prometheus --version
prometheus, version 2.25.0 (branch: HEAD, revision: a6be548dbc17780d562a39c0e4bd0bd4c00ad6e2)
  build user:       root@615f028225c9
  build date:       20210217-14:17:24
  go version:       go1.15.8
  platform:         linux/amd64
[root@VM_2-45 /usr/local/prometheus]#
1234567
查看帮助文档
[root@VM_2-45 /usr/local/prometheus]# ./prometheus --help
1
2.1 prometheus.yml 配置解释
# my global config
global:
# 默认情况下,每15s拉取一次目标采样点数据。
scrape_interval: 15s # Set the scrape interval to every 15 seconds. Default is every 1 minute.
# 每15秒评估一次规则。默认值为每1分钟。
evaluation_interval: 15s # Evaluate rules every 15 seconds. The default is every 1 minute.
# scrape_timeout is set to the global default (10s).
# Alertmanager configuration
alerting:
alertmanagers:
- static_configs:
- targets:
# - alertmanager:9093
# Load rules once and periodically evaluate them according to the global 'evaluation_interval'.
rule_files:
# - "first_rules.yml"
# - "second_rules.yml"
# A scrape configuration containing exactly one endpoint to scrape:
# Here it's Prometheus itself.
scrape_configs:
# job名称会增加到拉取到的所有采样点上,同时还有一个instance目标服务的host:port标签也会增加到采样点上
- job_name: 'prometheus'
# 覆盖global的采样点,拉取时间间隔5s
scrape_interval: 5s
static_configs:
- targets: ['localhost:9090']2.2 启动服务
# 启动服务
[root@VM_2-45 /usr/local/prometheus]# ./prometheus --config.file=prometheus.yml
# 指定配置文件
--config.file="prometheus.yml"
# 默认指定监听地址端口,可修改端口
--web.listen-address="0.0.0.0:9090"
# 最大连接数
--web.max-connections=512
# tsdb数据存储的目录,默认当前data/
--storage.tsdb.path="data/"
# premetheus 存储数据的时间,默认保存15天
--storage.tsdb.retention=15d
# 通过命令热加载无需重启 curl -XPOST 192.168.2.45:9090/-/reload
--web.enable-lifecycle
# 可以启用 TLS 或 身份验证 的配置文件的路径
--web.config.file=""
启动选项了解:./prometheus --help
1234567891011121314151617181920212.3 访问:http://localhost:9090
2.4 查看暴露指标
2.5 将Prometheus配置为系统服务
1.进入systemd目录下:cd /usr/lib/systemd/system
[root@VM_2-45 ~]# cd /usr/lib/systemd/system
1
2.创建文件:vim prometheus.service
[Unit]
  Description=https://prometheus.io

  [Service]
  User=prometheus
  Group=prometheus
  Restart=on-failure
  ExecStart=/usr/local/prometheus/prometheus --config.file=/usr/local/prometheus/prometheus.yml --web.listen-address=:9090

  [Install]
  WantedBy=multi-user.target
3.生效系统system文件
systemctl daemon-reload
1
4.启动服务
[root@VM_2-45 ~]# systemctl start prometheus3.1 客户端安装node_exporter
3.1.1 监控Linux 安装常用node_exporter
[root@VM_2-44 ~]# wget https://github.com/prometheus/node_exporter/releases/download/v1.8.1/node_exporter-1.8.1.linux-amd64.tar.gz
[root@VM_2-44 ~]# tar xf node_exporter-1.8.1.linux-amd64.tar.gz -C /usr/local/
[root@VM_2-44 ~]# mv node_exporter-1.8.1.linux-amd64/ node_exporter
chown -R prometheus.prometheus /usr/local/node_exporter
3.1.2 启动node_exporter,并添加到服务
# 直接启动
[root@VM_2-44 /usr/local/node_exporter]# ./node_exporter &
# 启动后会监听9100端口

# 添加为服务方式启动
[root@VM_2-44 ~]# vim /usr/lib/systemd/system/node_exporter.service
[Unit]
Description=node_exporter
After=network.target

[Service]
User=prometheus
Group=prometheus
ExecStart=/usr/local/node_exporter/node_exporter
Restart=on-failure

[Install]
WantedBy=multi-user.target

# 启动node_exporter
systemctl daemon-reload
systemctl start node_exporter
3.1.3 普罗米修斯服务端配置文件添加监控项
[root@VM_2-45 /usr/local/prometheus]# cat prometheus.yml
# my global config
global:
  scrape_interval:     15s # Set the scrape interval to every 15 seconds. Default is every 1 minute.
  evaluation_interval: 15s # Evaluate rules every 15 seconds. The default is every 1 minute.
  # scrape_timeout is set to the global default (10s).

# Alertmanager configuration
alerting:
  alertmanagers:
  - static_configs:
    - targets:
      # - alertmanager:9093

# Load rules once and periodically evaluate them according to the global 'evaluation_interval'.
rule_files:
scrape_configs:
  - job_name: 'prometheus'
    static_configs:
    - targets: ['192.168.2.45:9090']

  - job_name: 'linux'
    static_configs:
    - targets: ['192.168.2.44:9100','192.168.2.43:9100'] # 多个用,分开

# 添加上面三行
3.1.4 重启普罗米修斯
[root@VM_2-45 /usr/local/prometheus]# systemctl restart prometheus.service打开普罗米修斯自带的监控页面,Status -> Targets 查看:
4.部署Alertmanager
Alertmanager和Prometheus Server一样均采用Golang实现,并且没有第三方依赖。一般来说我们可以通过以下几种方式来部署Alertmanager:二进制包、容器以及源码方式安装。
使用二进制包部署AlertManager
wget https://github.com/prometheus/alertmanager/releases/download/v0.27.0/alertmanager-0.27.0.linux-amd64.tar.gz
tar -zxvf alertmanager-0.27.0.linux-amd64.tar.gz

mv alertmanager-0.27.0.linux-amd64 /usr/local/alertmanager

chown -R prometheus.prometheus /usr/local/alertmanager
启动altermanager,并加入system管理
cat /usr/lib/systemd/system/alertmanager.service

[Unit]
Description=AlertManager
Documentation=
After=network.target

[Service]
User=prometheus
Group=prometheus
WorkingDirectory=/usr/local/alertmanager
ExecStart=/usr/local/alertmanager/alertmanager
ExecReload=/bin/kill -HUP $MAINPID
ExecStop=/bin/kill -KILL $MAINPID
Type=simple
KillMode=control-group
Restart=on-failure
RestartSec=100ms

[Install]

cp /usr/local/alertmanager/alertmanager.yml /usr/local/alertmanager/alertmanager.yml.bak
检查语法
./amtool check-config alertmanager.yml启动Alertmanager
systemctl start alertmanager && systemctl enable alertmanagerAlertmanager启动后可以通过9093端口访问,http://192.168.10.10:9093
3.2、alertmanager配置文件
默认的alertmanager.yml配置文件,内容如下所示:
# 全局配置
global:
  # 告警超时时间
  resolve_timeout: 5m
# 路由配置
route:
  # 用于将传入警报分组在一起的标签。
  group_by: ['alertname']
  # 发送通知的初始等待时间
  group_wait: 30s
  # 在发送有关新警报的通知之前需要等待多长时间
  group_interval: 5m
  # 如果已发送通知,则在再次发送通知之前要等待多长时间,通常约3小时或更长时间
  repeat_interval: 1h
  # 接受者名称
  receiver: 'web.hook'
# 接受者
receivers:
# 接受者名称
- name: 'web.hook'
  # webhook URL
  webhook_configs:
  - url: 'http://127.0.0.1:5001/'
# 抑制规则
inhibit_rules:
  - source_match:
      # 原标签匹配=》告警级别:严重
      severity: 'critical'
    target_match:
      # 目标标签匹配=》告警级别:警告
      severity: 'warning'
    # 警报中必须有以下标签值才会被抑制。
    equal: ['alertname', 'dev', 'instance']
Alertmanager的配置主要包含两个部分:路由(route)以及接收器(receivers)。所有的告警信息都会从配置中 的顶级路由(route)进入路由树,根据路由规则将告警信息发送给相应的接收器。
在Alertmanager中可以定义一组接收器,比如可以按照角色(比如系统运维,数据库管理员)来划分多个接收器。接 收器可以关联邮件,Slack以及其它方式接收告警信息。
当前配置文件中定义了一个默认的接收者default-receiver由于这里没有设置接收方式,目前只相当于一个占位符。
在配置文件中使用route定义了顶级的路由,路由是一个基于标签匹配规则的树状结构。所有的告警信息从顶级路由 开始,根据标签匹配规则进入到不同的子路由,并且根据子路由设置的接收器发送告警。目前配置文件中只设置了一 个顶级路由route并且定义的接收器为default-receiver。因此,所有的告警都会发送给default-receiver。
3.3、关联Prometheus与Alertmanager
在Prometheus的架构中被划分成两个独立的部分。Prometheus负责产生告警,而Alertmanager负责告警产生后 的后续处理。因此Alertmanager部署完成后,需要在Prometheus中设置Alertmanager相关的信息。
编辑Prometheus配置文件prometheus.yml,并添加以下内容
alerting:
  alertmanagers:
  - static_configs:
    - targets: ['192.168.199.23:9093']
或者
# 监控资源配置
scrape_configs:
   # Alertmanager 监控
  - job_name: 'alters'
    static_configs:
    - targets: ['localhost:9093']

#告警规则配置文件位置:
rule_files:
  - "alert.yml"


vim alert.yml


groups:
- name: Prometheus alert
  rules:
  - alert: 服务告警
    expr: up == 0
    for: 30s
    labels:
      severity: critical
      opsalertname: 服务器宕机告警
    annotations:
      instance: "{{ $labels.instance }}"
      description: "{{ $labels.job }} 服务已关闭"

  - alert: 磁盘空间使用率告警
    expr: 100
      - (node_filesystem_avail_bytes{fstype=~"xfs|ext4",job="node_exporter"}
      / node_filesystem_size_bytes{fstype=~"xfs|ext4",job="node_exporter"}) * 100
      > 80
    for: 10m
    labels:
      severity: critical
      opsalertname: 磁盘空间使用率告警
    annotations:
      summary: '磁盘使用率告警'
      description: |
        磁盘使用: {{ $labels.mountpoint }}分区磁盘使用率{{ $value | humanize }} %, 大于告警阈值90%
  - alert: 磁盘inode使用率告警
    expr: 100 - (node_filesystem_files_free{job="node_exporter",fstype=~"ext4|xfs"} / node_filesystem_files{job="node_exporter",fstype=~"ext4|xfs"}) * 100  > 80
    for: 15m
    labels:
      severity: critical
      opsalertname: 磁盘inode使用率告警
    annotations:
      summary: "磁盘Inode告警"
      description: |
        Inode使用: {{ $value | humanize }} %, 大于告警阈值80%

  - alert: 内存使用率告警
    expr: 100 - ( node_memory_MemAvailable_bytes / node_memory_MemTotal_bytes ) * 100 > 10
    for: 10s #正常值为5m
    labels:
      severity: critical
      opsalertname: 内存使用率告警
    annotations:
      summary: '内存使用率告警'
      description: |
        内存使用率告警 {{ $value | humanize }} %, 大于告警阈值90%
##上面那个不行就用这个
cat >/opt/prometheus/alert.yml <<"EOF"
groups:
- name: Prometheus alert
rules:
# 对任何实例超过30s无法联系的情况发出警报
- alert: 服务告警
expr: up == 0
for: 30s
labels:
severity: critical
annotations:
instance: "{{ $labels.instance }}"
description: "{{ $labels.job }} 服务已关闭"
EOF重启Prometheus服务,成功后,可以从http://192.168.33.10:9090/config查看alerting配置是否生效。
5.安装grafana
使用的阿里源下载安装的
yum -y localinstall https://mirrors.aliyun.com/grafana/yum/rpm/Packages/grafana-10.2.7-1.x86_64.rpm或者使用官方源码安装
wget https://dl.grafana.com/enterprise/release/grafana-enterprise-10.2.7.linux-amd64.tar.gz
tar -zxvf grafana-enterprise-10.2.7.linux-amd64.tar.gz
mv grafana-v10.2.7 /usr/local/grafana
chown -R prometheus.prometheus /usr/local/grafana/
vim /etc/systemd/system/grafana.service
[Unit]
Description=grafana
[Service]
ExecStart=/usr/local/grafana/bin/grafana-server -homepath=/usr/local/grafana
ExecReload=/bin/kill -HUP $MAINPID
KillMode=process
Restart=on-failure
[Install]
WantedBy=multi-user.target
systemctl start grafana
用户和密码都是admin
在 grafana默认配置 /usr/local/grafana/conf/defaults.ini 中,将default_language = en-US改为 zh-Hans即可,存在部分翻译不完全什么是Exporter
概述
所有可以向Prometheus提供监控样本数据的程序都可以被称为一个Exporter.而Exporter的一个实例称为target,如图下所示,
Prometheus通过轮询的方式定期从这些target中获取样本数据:
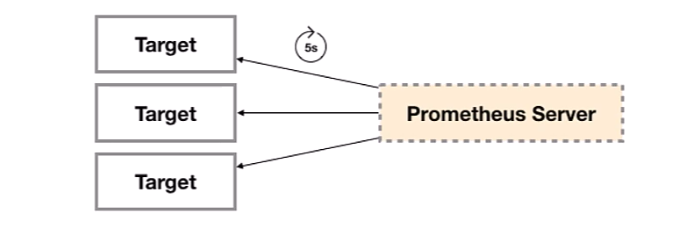
这里Prometheus是通过pull(拉取的方式)从Target中获取样本数据
安装好Exporter后会暴露一个/metrics的HTTP服务,通过Prometheus添加配置Prometheus就可以采集到这个/metrics里面的所有监控样本数据
代码语言:txt
复制
- targets: ['node_exporter:9100'] 会自动带上/metricsExporter的来源
从exporter的来源上来讲,一共分俩类:
社区提供的
社区提供 (https://prometheus.io/docs/instrumenting/exporters/)
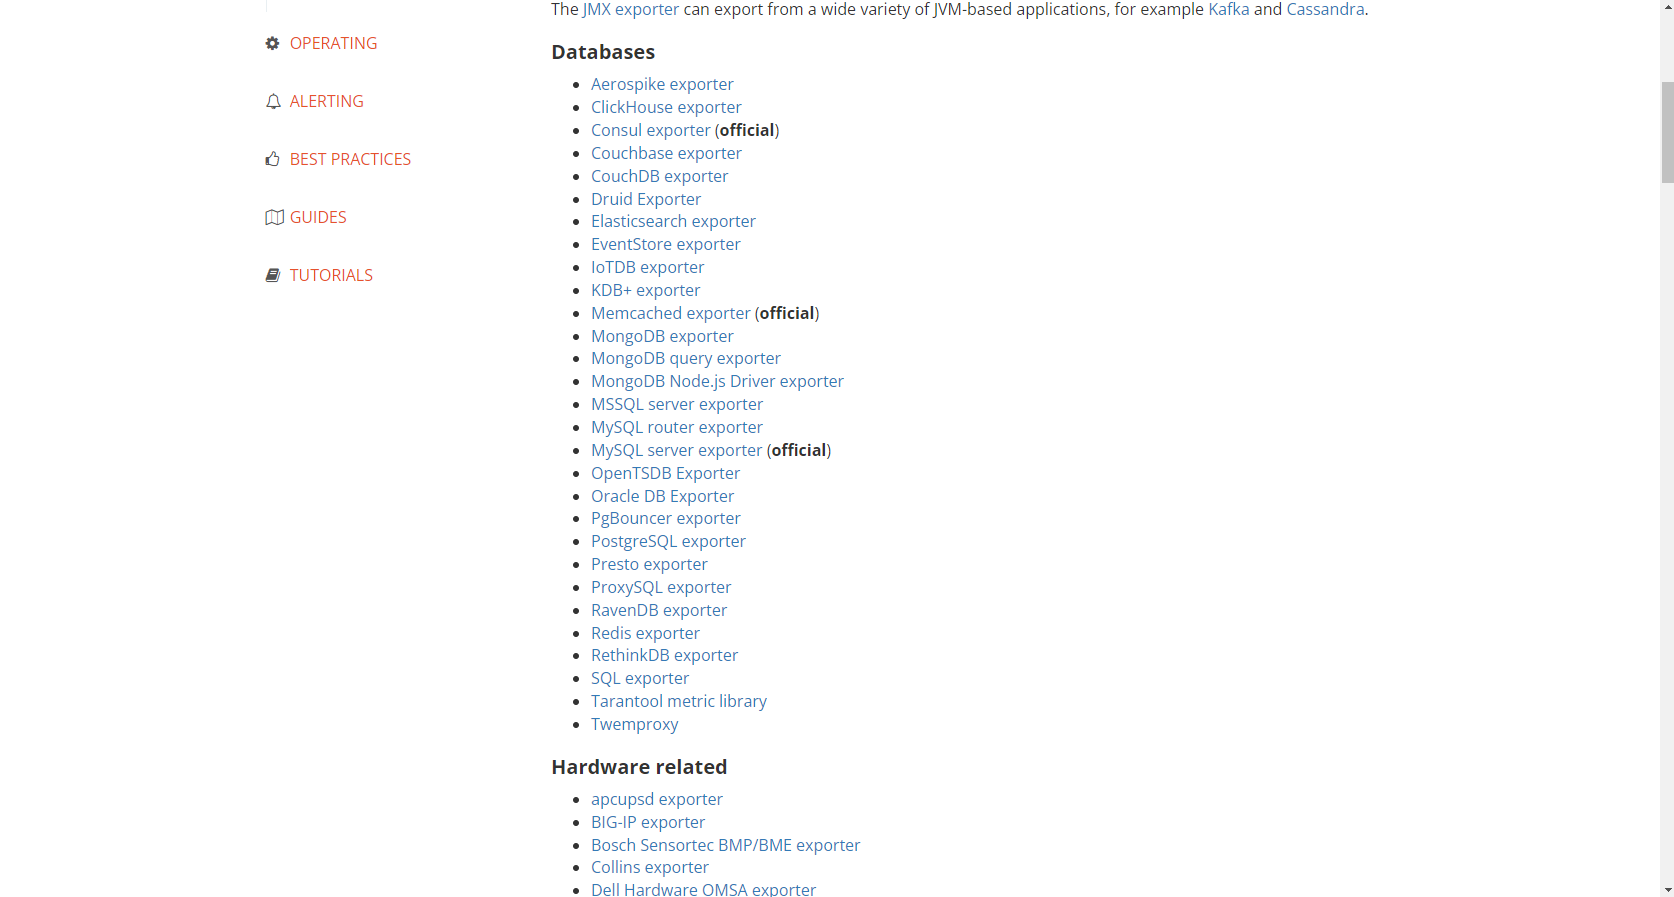
Prometheus社区提供了丰富的Exporter实现,涵盖了从基础设施,中间件一级网络等各个方面的监控功能.这些Exporter可以实现大部分通用的监控需求.下表列举一些社区中常用的Exporter:
用户自定义
除了直接使用社区提供的Exporter程序意外,用户还可以基于Prometheus提供的Client Library创建自己的Exporter程序,目前Prometheus社区官方提供了对以下编程语言的支持:Go,java,Python,Ruby.同事还有第三方实现的如:Bash,C++,Common Lisp,Erlang,Haskeel,Lua,Node.js,PHP,Rust等.
Exporter类型
通常来说可以将Exporter分为俩类
直接采集型 这类Exporter直接内置了相应的应用程序,用于向Prometheus直接提供Target数据支持.这样设计的好处是,可以更好的监控各自系统的内部运行状态,同时也适合更多自定义监控指标的项目实施.例如k8s 等.他们均内置了用于Prometheus提供监控数据的端点.
间接采集型 原始监控目标并不直接支持Prometheus,需要我们使用Prometheus提供的Client Library编写该监控目标的监控采集程序,用户可以将该程序独立运行,去获取指定的各类监控数据值.例如,由于Linux操作系统自身并不能直接支持Prometheus.用户无法从操作系统层面上直接提供对Prometheus的支持,因此单独安装Node Exporter,还有数据库或网站HTTP应用类等Exporter.
Exporter规范
所有的Exporter程序都需要按照Prometheus的规范,返回监控的样本数据.以Node Exporter为例,当访问/metrics结尾地址时会返回一下内容:
代码语言:txt
复制
# HELP go_gc_duration_seconds A summary of the pause duration of garbage collection cycles.
# TYPE go_gc_duration_seconds summary
go_gc_duration_seconds{quantile="0"} 4.029e-05
go_gc_duration_seconds{quantile="0.25"} 5.2092e-05
go_gc_duration_seconds{quantile="0.5"} 6.3091e-05
go_gc_duration_seconds{quantile="0.75"} 8.9905e-05
go_gc_duration_seconds{quantile="1"} 0.000300032
go_gc_duration_seconds_sum 2.6172319120000003
go_gc_duration_seconds_count 36170
# HELP go_goroutines Number of goroutines that currently exist.
# TYPE go_goroutines gauge
go_goroutines 9
# HELP go_info Information about the Go environment.
# TYPE go_info gauge
go_info{version="go1.19.3"} 1
# HELP go_memstats_alloc_bytes Number of bytes allocated and still in use.
# TYPE go_memstats_alloc_bytes gauge
go_memstats_alloc_bytes 2.19788e+06
以#开头的行通常都是注释内容,这些样本数据集合说明如下:
以#HELP开始的行,表示metric的帮助与说明注释,可以包含当前监控指标名称和对应的说明信息.
以#TYPE开始的行,表示定义metric类型,可以包含当前监控指标名称和类型,类型有Counter,Gauge....
非#开头的行,就是监控样本数据
样本数据如何存储Prometheus的库中
代码语言:txt
复制
//这种方式进行展示
go_memstats_alloc_bytes 2.19788e+06
//这种方式进行存储
go_memstats_alloc_bytes{instance="localhost:9090", job="prometheus"} timestamp(时间戳) value(样本值)
监控Linux
3.1.1 监控Linux 安装常用node_exporter
[root@VM_2-44 ~]# wget https://github.com/prometheus/node_exporter/releases/download/v1.8.1/node_exporter-1.8.1.linux-amd64.tar.gz
[root@VM_2-44 ~]# tar xf node_exporter-1.8.1.linux-amd64.tar.gz -C /usr/local/
[root@VM_2-44 ~]# mv node_exporter-1.8.1.linux-amd64/ node_exporter
chown -R prometheus.prometheus /usr/local/node_exporter
3.1.2 启动node_exporter,并添加到服务
# 直接启动
[root@VM_2-44 /usr/local/node_exporter]# ./node_exporter &
# 启动后会监听9100端口

# 添加为服务方式启动
[root@VM_2-44 ~]# vim /usr/lib/systemd/system/node_exporter.service
[Unit]
Description=node_exporter
After=network.target

[Service]
User=prometheus
Group=prometheus
ExecStart=/usr/local/node_exporter/node_exporter
Restart=on-failure

[Install]
WantedBy=multi-user.target

# 启动node_exporter
systemctl daemon-reload
systemctl start node_exporter
3.1.3 普罗米修斯服务端配置文件添加监控项
[root@VM_2-45 /usr/local/prometheus]# cat prometheus.yml
# my global config
global:
  scrape_interval:     15s # Set the scrape interval to every 15 seconds. Default is every 1 minute.
  evaluation_interval: 15s # Evaluate rules every 15 seconds. The default is every 1 minute.
  # scrape_timeout is set to the global default (10s).

# Alertmanager configuration
alerting:
  alertmanagers:
  - static_configs:
    - targets:
      # - alertmanager:9093

# Load rules once and periodically evaluate them according to the global 'evaluation_interval'.
rule_files:
scrape_configs:
  - job_name: 'prometheus'
    static_configs:
    - targets: ['192.168.2.45:9090']

  - job_name: 'linux'
    static_configs:
    - targets: ['192.168.2.44:9100','192.168.2.43:9100'] # 多个用,分开

# 添加上面三行
3.1.4 重启普罗米修斯
[root@VM_2-45 /usr/local/prometheus]# systemctl restart prometheus.service在grafana导入1860模板
监控nginx
nginx开启stub_status
监控nginx需要with-http_stub_status_module这个模块
首先检查是否有安装with-http_stub_status_module模块
一、安装Nginx
\1) 安装依赖库
yum install -y gcc gcc-c++ make libtool wget pcre pcre-devel zlib zlib-devel openssl openssl-devel2)下载nginx版本包
wget http://nginx.org/download/nginx-1.12.1.tar.gz3)安装nginx
# 解压
tar -zxvf nginx-1.12.1.tar.gz
# 预编译

./configure --prefix=/usr/local/nginx --with-http_stub_status_module

# 编译&安装
make && make install
nginx开启stub_status配置
将下面配置文件写到nginx.conf配置文件中:
server {
	.....
	location /stub_status {
		stub_status on;
		access_log off;
		allow 0.0.0.0/0;
		deny all;
	}
	....
}
####
docker方式安装
docker exec -it nginx nginx -v 2>&1 |grep -o with-http_stub_status_modulenginx安装包方式安装
nginx nginx -v 2>&1 |grep -o with-http_stub_status_module重新加载配置文件
docker exec -it nginx nginx -s reload
systemctl restart nginx
检查是否开启成功
curl http://localhost/stub_status安装nginx-prometheus-exporter
1)下载nginx-prometheus-exporter
wget https://github.com/nginxinc/nginx-prometheus-exporter/releases/download/v0.11.0/nginx-prometheus-exporter_0.11.0_linux_amd64.tar.gz2)将nginx-prometheus-exporter安装包进行解压
tar -zxvf nginx-prometheus-exporter_0.11.0_linux_amd64.tar.gz -C /usr/local3)启动nginx-prometheus-exporter
# 启动命令
/usr/local/nginx-prometheus-exporter -nginx.scrape-uri http://127.0.0.1:80/stub_status
# 日志:
NGINX Prometheus Exporter version=0.11.0 commit=e4a6810d4f0b776f7fde37fea1d84e4c7284b72a date=2022-09-07T21:09:51Z, dirty=false, arch=linux/amd64, go=go1.19
2023/03/24 20:55:00 Starting...
2023/03/24 20:55:00 Listening on :9113
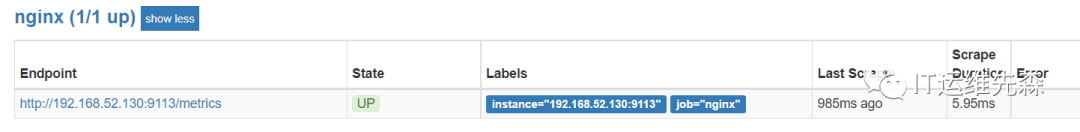
2023/03/24 20:55:00 NGINX Prometheus Exporter has successfully started修改Prometheus.yml文件
- job_name: "nginx"
    static_configs:
    - targets: ['192.168.52.130:9113']
添加触发器
- name: nginx
  rules:
  # 任何势力超过30秒无法联系的情况发出警报
  - alert: NginxDown
    expr: nginx_up ==0
    for: 30s
    labels:
      severity: critical
    annotations:
      summary: "nginx异常,实例:{{ $labels.instance }}"
      description: "{{ $labels.job }} nginx已关闭"
四、访问Prometheus
五、在Grafana导入模板
1)、导入模板
模板链接:https://grafana.com/grafana/dashboards/12708
2)Nginx各项指标信息一屏全揽
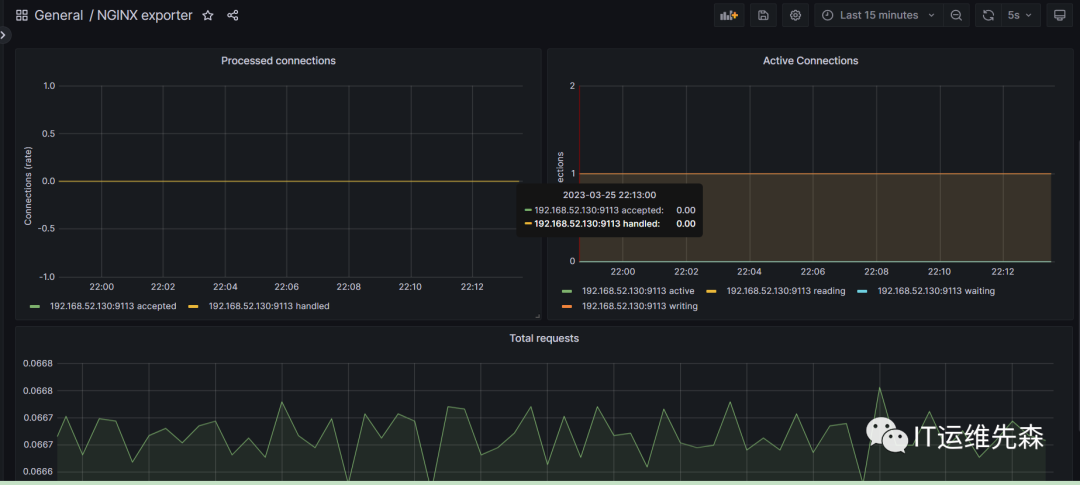
常用的nginx监控指标
nginx_connections_accepted	接受请求数
nginx_connections_active	活动连接数
nginx_connections_handled	成功处理请求数
nginx_connections_reding	正在进行读操作的请求数
nginx_connections_waiting	正在等待的请求数
nginx_connections_writing	正在进行写操作的请求数
nginx_connections_requests	总请求数
监控redis
下载Redis
进入官网找到下载地址 https://redis.io/download
右键Download按钮,选择复制链接。 进入到Xshell控制台(默认当前是root根目录),输入wget 将上面复制的下载链接粘贴上,如下命令:
wget http:``//download.redis.io/releases/redis-5.0.7.tar.gz解压并安装Redis
$ yum install gcc make -y
redis安装路径/usr/local/redis
##解压
$ cd /usr/local/src
$ wget https://download.redis.io/releases/redis-6.2.9.tar.gz
$ tar zxf redis-4.0.11.tar.gz
##进入解压目录并编译安装
$ cd /usr/local/src/redis-4.0.11
$ make PREFIX=/usr/local/redis install
$ make install
#进入redis安装目录中的utils目录中执行install_server.sh脚本
$ cd /usr/local/src/redis-4.0.11/utils/
$ ./install_server.sh
Welcome to the redis service installer
This script will help you easily set up a running redis server

Please select the redis port for this instance: [6379]
Selecting default: 6379
Please select the redis config file name [/etc/redis/6379.conf] /usr/local/redis/6379.conf
Please select the redis log file name [/var/log/redis_6379.log] /usr/local/redis/logs/redis_6379.log
Please select the data directory for this instance [/var/lib/redis/6379] /usr/local/redis/6379
Please select the redis executable path [/usr/local/bin/redis-server] /usr/local/redis/bin/redis-server
Selected config:
Port           : 6379
Config file    : /usr/local/redis/6379onf
Log file       : /usr/local/redis/logs/redis_6379.log
Data dir       : /usr/local/redis/6379
Executable     : /usr/local/redis/bin/redis-server
Cli Executable : /usr/local/bin/redis-cli
Is this ok? Then press ENTER to go on or Ctrl-C to abort.
Copied /tmp/6379.conf => /etc/init.d/redis_6379
Installing service...
Success!
Starting Redis server...
Installation successful!
创建redis systemd文件
vim /etc/systemd/system/redis.service
#添加如下内容
[Unit]
Description=Redis In-Memory Data Store
After=network.target

[Service]
User=root
Group=root
Type=forking
ExecStart=/usr/local/bin/redis-server /etc/redis/6379.conf
ExecStop=/usr/local/bin/redis-cli shutdown
Restart=always

[Install]
WantedBy=multi-user.target

$ systemctl daemon-reload
$ systemctl start redis
$ systemctl status redis

# 远程主机连接
$ redis-cli  -h  redis_ip -p redis_port -a password
启动redis
根据上面的操作已经将redis安装完成了。在目录/usr/local/redis 输入下面命令启动redis
./bin/redis-server& ./redis.conf上面的启动方式是采取后台进程方式,下面是采取显示启动方式(如在配置文件设置了daemonize属性为yes则跟后台进程方式启动其实一样)。
./bin/redis-server ./redis.conf两种方式区别无非是有无带符号&的区别。 redis-server 后面是配置文件,目的是根据该配置文件的配置启动redis服务。redis.conf配置文件允许自定义多个配置文件,通过启动时指定读取哪个即可。
各个功能模块介绍
部署监控redis_node_exporter
安装redis_exporter
prometheus监控redis需要用到redis_exporter。 redis_exporter 项目地址:https://github.com/oliver006/redis_exporter
下载安装redis_exporter
$ cd /usr/local/src
$ wget https://github.com/oliver006/redis_exporter/releases/download/v1.59.0/redis_exporter-v1.59.0.linux-amd64.tar.gz
$ mkdir /usr/local/redis_exporter/
$ tar zxf redis_exporter-v1.59.0.linux-amd64.tar.gz -C /usr/local/redis_exporter/
redis_exporter 用法
解压后只有一个二进制程序就叫 redis_exporter 通过 -h 可以获取到帮助信息,下面列出一些常用的选项:
-redis.addr:指明一个或多个 Redis 节点的地址,多个节点使用逗号分隔,默认为 redis://localhost:6379
-redis.password:验证 Redis 时使用的密码;
-redis.file:包含一个或多个redis 节点的文件路径,每行一个节点,此选项与 -redis.addr 互斥。
-web.listen-address:监听的地址和端口,默认为 0.0.0.0:9121
创建redis_exporter.service启动脚本
vim   /etc/systemd/system/redis_exporter.service
#添加如下内容:
[Unit]
Description=redis_exporter
Documentation=https://github.com/oliver006/redis_exporter
After=network.target

[Service]
Type=simple
User=root
ExecStart=/usr/local/redis_exporter/redis_exporter -redis.addr 127.0.0.1:6379 -web.listen-address=0.0.0.0:9121

Restart=on-failure

[Install]
WantedBy=multi-user.target
启动服务
$ systemctl daemon-reload
$ systemctl start redis_exporter
$ systemctl status redis_exporter
$ ss -tnl|grep 9121
集成Prometheus
$ vim /usr/local/prometheus/prometheus.yml
  - job_name: redis
    static_configs:
    - targets: ['localhost:9121']
重启服务。
$ systemctl restart prometheus常用的redis监控指标
redis_up                        服务器是否在线
redis_uptime_in_seconds                 运行时长,单位s
rate(redis_cpu_sys_seconds_total[1m])+rate(redis_cpu_user_seconds_total[1m])    占用CPU核数
redis_memory_used_bytes                 占用内存量
redis_memory_max_bytes                  限制的最大内存,如果没限制则为0
delta(redis_net_input_bytes_total[1m])          网络接受的bytes
delta(redis_net_output_bytes_total[1m])         网络发送的bytes
redis_connected_clients                 客户端连接数
redis_connected_clients / redis_config_maxclients
  连接数使用率
redis_rejected_connections_total
  拒绝的客户端连接数
redis_connected_slaves
  slave连接数
触发器配置
由于之前的触发器是全部写在了一个yml里面就是alert.yam,这样随着后面配置的触发器越来越多最终会变得难以维护.这里我们让它去读rules目录下所有的yml文件即可
Prometheus配置
rule_files:
  - "alert.yml"
  - "rules/*.yml"
配置redis触发器
因为是单机所以未配置集群的触发器
cat > prometheus/rules/redis.yml << 'EOF'
groups:
- name: redis
  rules:
  - alert: RedisDown
    expr: redis_up == 0
    for: 0m
    labels:
      severity: critical
    annotations:
      summary: 'Redis Down,实例: {{ $labels.instance }}'
      description: "Redis实例 is down"
  - alert: RedisMissingBackup
    expr: time() - redis_rdb_last_save_timestamp_seconds > 60 * 60 * 24
    for: 0m
    labels:
      severity: critical
    annotations:
      summary: 'Redis 备份丢失,实例: {{ $labels.instance }}'
      description: "Redis 24 小时未备份"
  - alert: RedisOutOfConfiguredMaxmemory
    expr: redis_memory_used_bytes / redis_memory_max_bytes * 100 > 90
    for: 2m
    labels:
      severity: warning
    annotations:
      summary: 'Redis Down,实例: {{ $labels.instance }}'
      description: "Redis实例 is down"
EOF
一定记住这里需要仔细校对yaml语法,最好是能去在线验证yaml语法的网站上看看.yaml语法还是比较严格的一点缩进错误都不能有
grafana展示Prometheus从redis_exporter收集到的数据
id :11835
id:763
监控mongodb
MongoDB 安装环境
linux使用CentOS 7.7 使用xshell和 xftp
1、下载 MongoDB 的linux安装包
进入mongodb官网: 链接: https://www.mongodb.com/
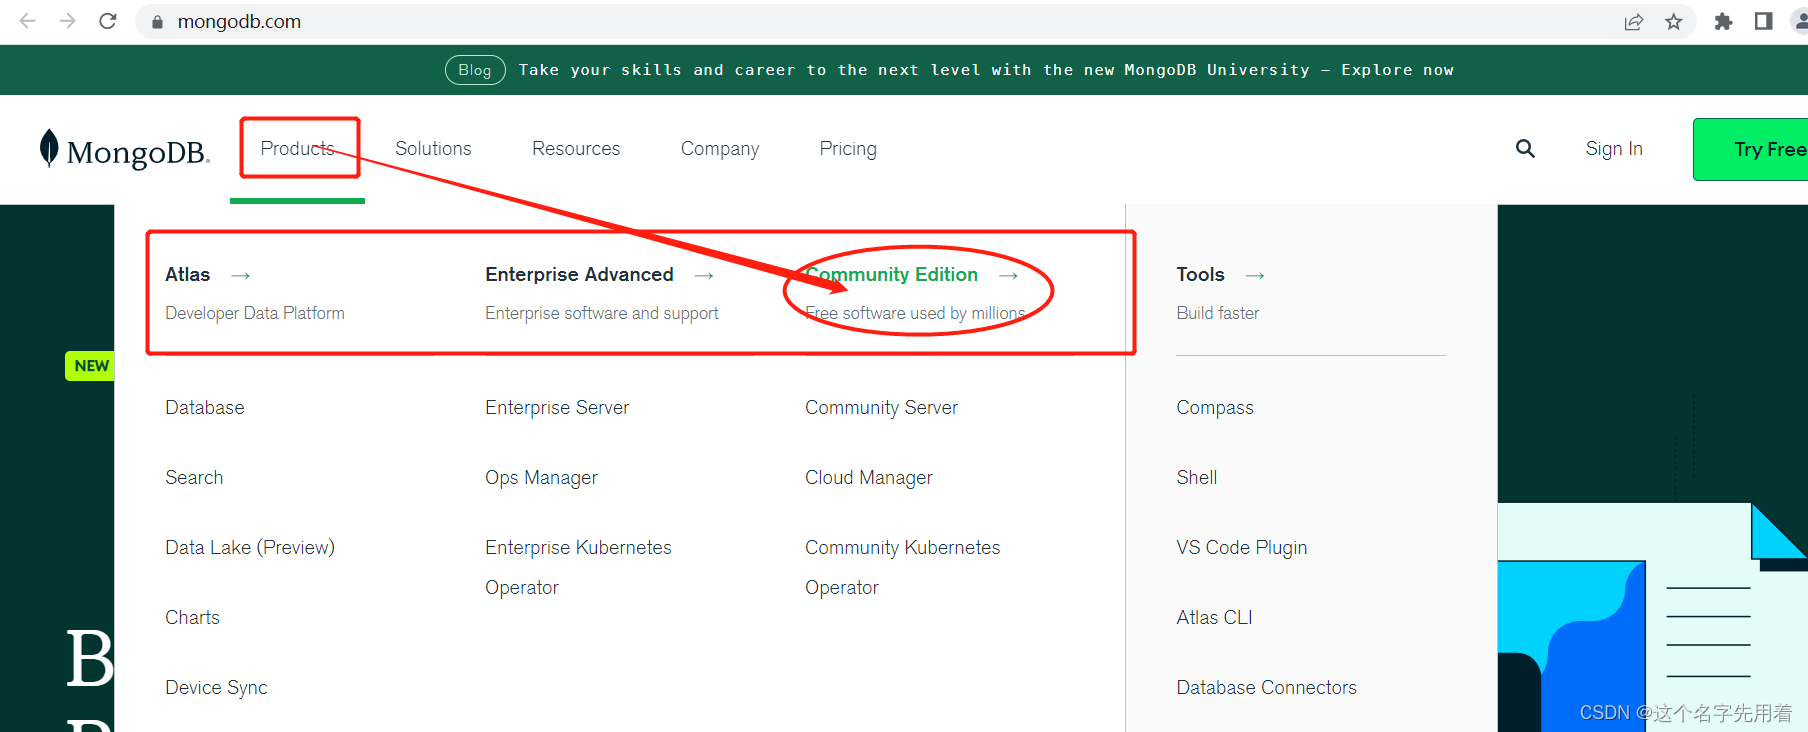
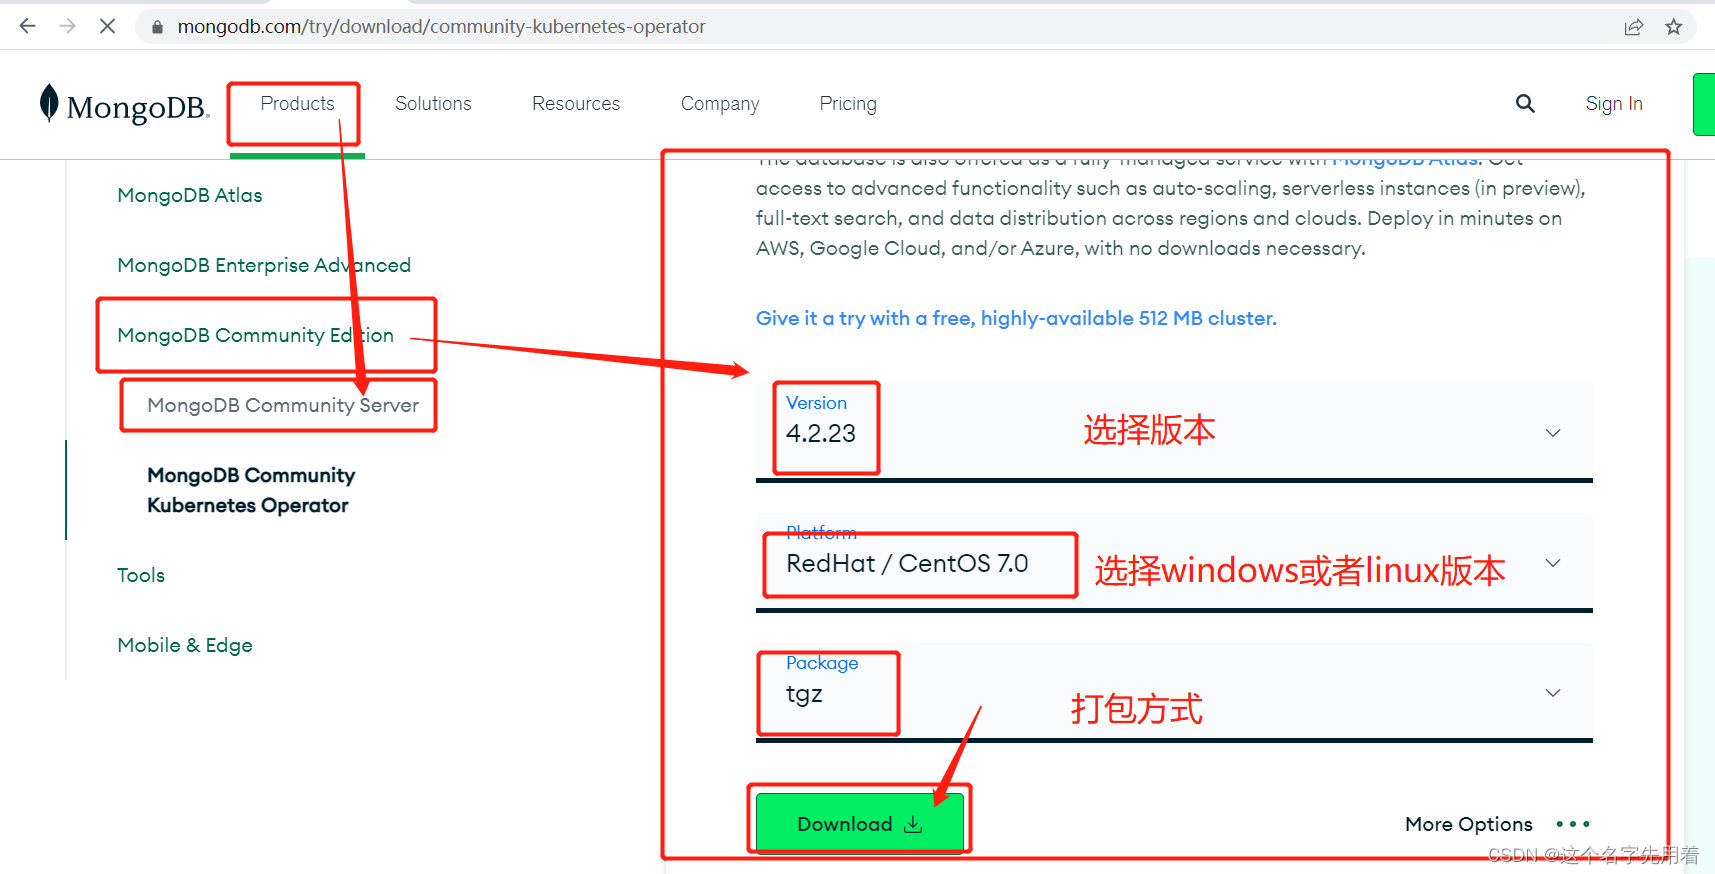
最终下载网址:https://www.mongodb.com/try/download/community
说明:使用社区版本,是免费的。
版本选择的建议和差异:
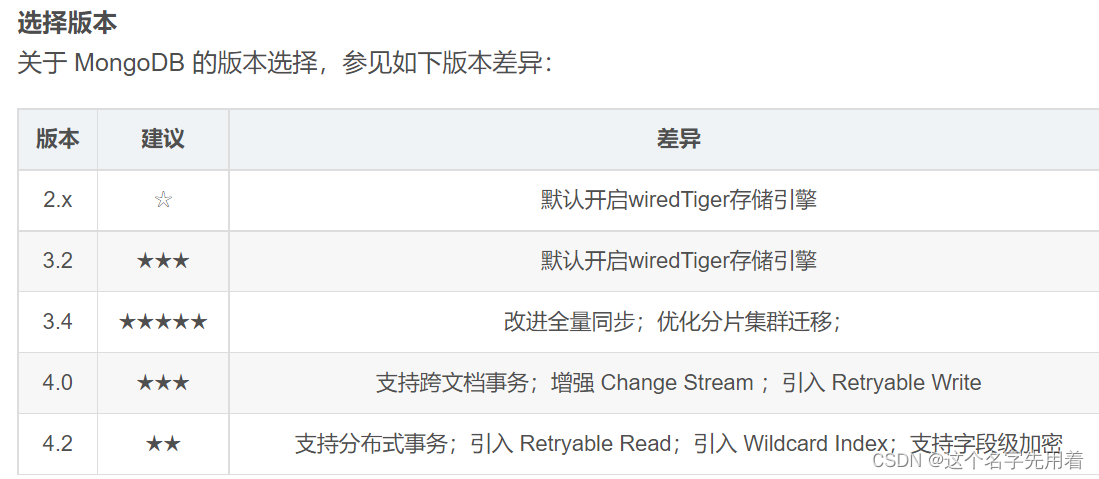
简而言之: 不需要事务,建议选择3.4 需要简单事务,建议选择4.0 需要分布式事务或其他必要功能,建议选择4.2 学习用途,建议选择最新版本
安装包使用tgz;
#下载安装包
https://fastdl.mongodb.org/linux/mongodb-linux-x86_64-rhel70-5.0.27.tgz
tar -zxvf  mongodb-linux-x86_64-rhel70-5.0.27.tg
mv mongodb-linux-x86_64-rhel70-5.0.27 /usr/local/mongodb
cd mongodb #进入文件夹
mkdir data
mkdir logs
touch /usr/local/mongodb/logs/mongodb.log
设置 MongoDB 环境变量
也可以不用设置环境变量进行启动,但是不设置环境变量启动的话要每次启动写很多启动参数,比较麻烦,所以做好配置环境变量。
不配置环境变量的启动如下:不建议:
配置环境变量的启动:
vim /etc/profile
在文件中增加以下配置:
export MONGODB_HOME=/usr/local/mongodb
export PATH=$MONGODB_HOME/bin:$PATH
source /etc/profile
添加 MongoDB 配置文件
vim /etc/mongodb.conf
添加一下常用配置:
#指定数据库路径
dbpath=/usr/local/mongodb/data
#指定MongoDB日志文件
logpath=/usr/local/mongodb/logs/mongodb.log
# 使用追加的方式写日志
logappend=true
#端口号
port=27017
#方便外网访问,外网所有ip都可以访问,不要写成固定的linux的ip
bind_ip=0.0.0.0
fork=true # 以守护进程的方式运行MongoDB,创建服务器进程
#auth=true #启用用户验证
#bind_ip=0.0.0.0 #绑定服务IP,若绑定127.0.0.1,则只能本机访问,不指定则默认本地所有IP
启动和关闭 MongoDB
进入 bin 目录
cd /usr/local/mongodb/bin
启动 MongoDB(-conf 使用配置文件方式启动)
mongod -f /etc/mongodb.conf
关闭 MongoDB(-conf 使用配置文件方式关闭 )
mongod --shutdown -f /etc/mongodb.conf
#查看进程 ps -ef | grep mongod
也可以杀死进程来关闭:kill -2 或者kill -15 进程号
操作mongo数据库
任意目录下,输入命令mongo即可进入数据库,配置了环境变量的前提下,否则需要在mongodb安装目录下的bin目录下使用 ./mongo 命令
mongo注意:如果一个数据库是没有安全认证的,不使用用户名密码即可登陆,这样是不安全的,所以我们应当授予权限才能操作数据库,这样再企业中才能保证数据安全性。
添加用户、安全认证
首先必须使用admin数据库,进行新用户授权。
MongoDB副本集默认会创建local、admin数据库,local数据库主要存储副本集的元数据,admin数据库则主要存储MongoDB的用户、角色等信息。

输入以下命令:
db.createUser({user:"root",pwd:"123456",roles:[{role:"root",db:"admin"}]})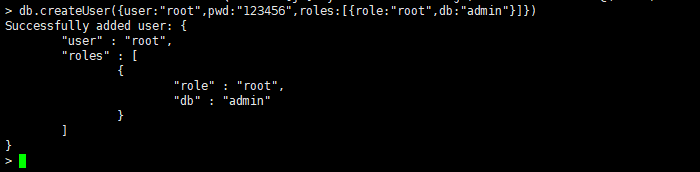
授权成功后,关闭mongo服务:
db.shutdownServer()#开启认证,必选先添加用户 auth=true
最后开启mongo服务,进入数据库测试:
./mongod --config /usr/local/mongodb/etc/mongodb.confshow dbs此时看不到任何数据库,说明我们的安全认证用户配置生效了。

首先使用use admin通过db.auth(‘root’,‘密码’) 输出1就是验证成功。
use admin
db.auth('root','123456')
安装mongodb_exporter
#下载安装包
wget https://github.com/percona/mongodb_exporter/releases/download/v0.40.0/mongodb_exporter-0.40.0.linux-amd64.tar.gz
tar -xf mongodb_exporter-0.40.0.linux-amd64.tar.gz
 mv mongodb_exporter-0.40.0.linux-amd64 /usr/local/mongodb_exporter
创建监控用户
登陆mongodb创建监控用户,权限为“readAnyDatabase”,如果是cluster环境,需要有权限“clusterMonitor”
docker exec -it mongo mongo admin
创建监控用户

> db.auth('root','123456')
1
> db.createUser({ user:'exporter',pwd:'password',roles:[ { role:'readAnyDatabase', db: 'admin'},{ role: "clusterMonitor", db: "admin" }]});
#测试 使用上面创建的用户信息进行连接。
> db.auth('exporter', 'password')
1
#表示成功
> exit
二进制安装:
mongodb_exporter地址:https://github.com/percona/mongodb_exporter/releases
或:https://github.com/prometheus/mysqld_exporter/releases
systemd服务
vim /usr/lib/systemd/system/mongodb_exporter.service
[Unit]
Description=mongodb_exporter
Documentation=https://github.com/percona/mongodb_exporter
After=network.target

[Service]
Type=simple
User=root
Environment="MONGODB_URI=mongodb://exporter:password@192.168.10.11:27017/admin"
ExecStart=/usr/local/mongodb_exporter/mongodb_exporter --log.level=error --collect-all --compatible-mode
Restart=on-failure

[Install]
WantedBy=multi-user.target
参数解释
metrics地址:http://192.168.10.100:9216/metrics
Prometheus配置
配置prometheus去采集(拉取)mongodb_exporter的监控样本数据
  - job_name: "mongodb"
    static_configs:
    - targets: ['192.168.10.11:9216']
常用的监控指标
mongodb_ss_connections{conn_type="available"} 可用的连接总数

mongodb_ss_mem_virtual
mongodb_ss_mem_resident


# 关于 server status
mongodb_up                                              # 服务器是否在线
mongodb_ss_ok{cl_id="", cl_role="mongod", rs_state="0"} # 服务器是否正常运行,取值为 1、0 。标签中记录了 Cluster、ReplicaSet 的信息
mongodb_ss_uptime                                       # 服务器的运行时长,单位为秒
mongodb_ss_connections{conn_type="current"}             # 客户端连接数

# 关于主机
mongodb_sys_cpu_num_cpus                                # 主机的 CPU 核数

# 关于 collection
mongodb_collstats_storageStats_count{database="xx", collection="xx"}  # collection 全部文档的数量
mongodb_collstats_storageStats_size                     # collection 全部文档的体积,单位 bytes
mongodb_collstats_storageStats_storageSize              # collection 全部文档占用的磁盘空间,默认会压缩
delta(mongodb_collstats_latencyStats_reads_ops[1m])     # collection 读操作的数量(每分钟)
delta(mongodb_collstats_latencyStats_reads_latency[1m]) # collection 读操作的延迟(每分钟),单位为微秒
mongodb_collstats_latencyStats_write_ops
mongodb_collstats_latencyStats_write_latency

# 关于 index
mongodb_collstats_storageStats_nindexes                 # collection 的 index 数量
mongodb_collstats_storageStats_totalIndexSize           # collection 的 index 占用的磁盘空间
delta(mongodb_indexstats_accesses_ops[1m])   # index 被访问次数

# 关于操作
delta(mongodb_ss_opcounters[1m])                        # 执行各种操作的数量
delta(mongodb_ss_opLatencies_latency[1m])               # 执行各种操作的延迟,单位为微秒
delta(mongodb_ss_metrics_document[1m])                  # 各种文档的变化数量

# 关于锁
delta(mongodb_ss_locks_acquireCount{lock_mode="w"}[1m]) # 新加锁的数量。R 表示共享锁,W 表示独占锁,r 表示意向共享锁,w 表示意向独占锁
mongodb_ss_globalLock_currentQueue{count_type="total"}  # 被锁阻塞的操作数
触发器
cat >> prometheus/rules/mongodb.yml <<"EOF"
groups:
- name: PerconaMongodbExporter
  rules:
    - alert: MongodbDown
      expr: 'mongodb_up == 0'
      for: 0m
      labels:
        severity: critical
      annotations:
        summary: "MongoDB Down 容器: $labels.instance"
        description: "MongoDB 容器 is down, 当前值:{{ $value }}"

    - alert: MongodbNumberCursorsOpen
      expr: 'mongodb_ss_metrics_cursor_open{csr_type="total"} > 10 * 1000'
      for: 2m
      labels:
        severity: warning
      annotations:
        summary: "MongoDB 数字有标打开告警 容器: $labels.instance"
        description: "MongoDB 为客户端打开的游标过多 > 10k, 当前值:{{ $value }}"

    - alert: MongodbCursorsTimeouts
      expr: 'increase(mongodb_ss_metrics_cursor_timedOut[1m]) > 100'
      for: 2m
      labels:
        severity: warning
      annotations:
        summary: "MongoDB 游标超时 容器: $labels.instance"
        description: "太多游标超时, 当前值:{{ $value }}"

    - alert: MongodbTooManyConnections
      expr: 'avg by(instance) (rate(mongodb_ss_connections{conn_type="current"}[1m])) / avg by(instance) (sum (mongodb_ss_connections) by (instance)) * 100 > 80'
      for: 2m
      labels:
        severity: warning
      annotations:
        summary: "MongoDB 太多连接 容器: $labels.instance"
        description: "MongoDB 连接数 > 80%, 当前值:{{ $value }}"

    - alert: MongodbVirtualMemoryUsage
      expr: '(sum(mongodb_ss_mem_virtual) BY (instance) / sum(mongodb_ss_mem_resident) BY (instance)) > 3'
      for: 2m
      labels:
        severity: warning
      annotations:
        summary: "MongoDB虚拟内存使用告警 容器: $labels.instance"
        description: "虚拟内存使用过高, 当前值:{{ $value }}"
EOF
grafana dashboard展示
grafana展示prometheus从mongodb_exporter收集到的的数据
https://github.com/percona/grafana-dashboards/tree/main/dashboards/MongoDB
监控docker
1 概述
容器的使用已经非常普及,将服务迁移到容器上正成为了越来越多公司的选择。而对于运维人员而言,熟悉容器的使用与监控,也已成为一项必不可少的专业技能。
关于容器的开源产品,目前知名的有Docker、Containerd、CoreOS rkt、LXC 等,在这其中Docker占据了绝对的统治地位,也是当前使用最广泛的容器产品。以下是docker应用常用的两种监控方式:
Docker原生监控常用的方式有:docker ps/top/logs、docker stats、Docker Remote API、Docker伪文件系统。
但是原生的dockr命令监控的方式存在一点的局限性,针对这个问题,Google开源的容器度量收集工具cAdvisor可实现对容器的监控。
原生监控
2.1 docker stats
该命令默认以流式方式输出,如果想打印出最新的数据并立即退出,可以使用no-stream=true参数。可以指定一个已停止的容器,但是停止的容器不返回任何数据。
监控容器性能度量指标有多种方法,简单的如通过Docker的CPU、内存、网络及磁盘的使用情况进行监测,示例如下:
#  docker stats
CONTAINER ID    NAME         CPU %               MEM USAGE / LIMIT     MEM %               NET I/O             BLOCK I/O           PIDS
db9ee91008fc    cadvisor     1.95%               100.3MiB / 1.777GiB   5.51%               3.06MB / 718MB
伪文件系统
docker stats的数据来自/sys/fs/cgroup下的文件:
mem usage那一列的值,来自于/sys/fs/cgroup/memory/docker/[containerId]/memory.usage_in_bytes。
如果没限制内存,Limit=machine_mem,否则来自于/sys/fs/cgroup/memory/docker/[id]/memory.limit_in_bytes。
内存使用率=memory.usage_in_bytes/memory.limit_in_bytes。
一般情况下,cgroup文件夹下的内容包括CPU、内存、磁盘、网络等信息,下面列出常用的指标说明。
devices:设备权限控制。
cpuset:分配指定的CPU和内存节点。
cpu:控制CPU占用率。
cpuacct:统计CPU使用情况。
memory:限制内存的使用上限。
freezer:冻结(暂停)cgroup中的进程。
net_cls:配合tc(traffic controller)限制网络带宽。
net_prio:设置进程的网络流量优先级。
huge_tlb:限制HugeTLB的使用。
perf_event:允许Perf工具基于cgroup分组做性能监测。
在memory中常用的指标说明如下:
memory.usage_in_bytes:已使用的内存量(包含cache和buffer),相当于used_mem。
memory.limit_in_bytes:限制的内存总量(字节),相当于Linux的total_mem。
memory.failcnt:申请内存失败次数计数。
memory.memsw.usage_in_bytes:已使用的内存和swap容量(字节)。
memory.memsw.limit_in_bytes:限制的内存和swap容量(字节)。
memory.memsw.failcnt:申请内存和swap失效次数计数。
memory.stat:内存相关状态。
随着Docker容器云的广泛应用,大量的业务软件运行在容器中,这使得对Docker容器的监控越来越重要。对容器集群系统进行监控,一般采用物理机监控+容器本身监控的方式(如图10-2所示),具体监控指标总结如下:
容器本身资源使用情况:CPU、内存、网络、磁盘。
物理机的资源使用情况:CPU、内存、网络、磁盘。
物理机上容器镜像情况:名字、大小、版本。
目前较为流行的容器监控工具有DockerStats、cAdvisor、Scout、Data Dog以及Sensu。应用场景不同,各监控工具的优缺点体现得也有所不同。
DockerStats是Docker本身提供的,用于监控容器资源使用情况,直接输入命令行即可查看,还可提供远程API接口,易于操作,但没有图形界面。
cAdvisor可提供数据的可视化界面,并且可监控容器所在宿主机中的资源使用情况,只监控单一主机。
Scout可聚合多主机容器的监控,并且提供告警,但无法显示容器的详细信息,更多的是偏向于主机资源的监控,为收费项目。
Data Dog监控功能较为强大,可以获得运行和停止的容器计数以及镜像数量等,可整合集群主机数据和容器数据,但使用成本较高。
Sensu监控部署较为复杂。
cAdvisor架构
只需在宿主机上部署cAdvisor容器,用户就可通过Web界面或REST服务访问当前节点和容器的详尽性能数据(CPU、内存、网络、磁盘、文件系统等)。
cAdvisor支持一下指标:
容器基础指标。
容器内进程查看。
容器状态实践。
监控数据push到第三方存储介质。
通过Prometheus采集自定义指标。
通过容器标签采集应用自定义指标。
Collector可扩展开发其他标准类型,如数据库、Kafka、Redis等,当前只支持http方式采集应用自定义指标。
Storage可扩展开发其他介质。
cAdvisor软件架构如图10-3所示。
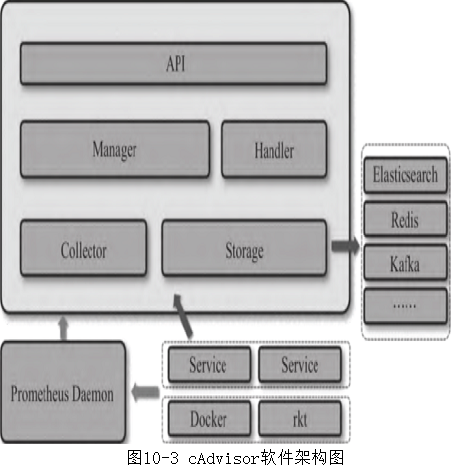
cAdvisor主要包括API层、Handler、Manager、Collector,具体说明如下:
API层:提供节点信息、容器运行状态信息、自定义指标信息、容器spec信息、事件信息、容器进程列表、文件系统信息的查询API。
Handler:提供rkt、Docker的容器spec以及Storage栈信息。内置有rkt、Docker的适配器被Manager调用。
Manager:总控,实例化Storage,为周期任务,通过Handler获取容器列表,自动发现容器的增/删等。
Collector:内置两种采集器,即Prometheus和自定义指标采集器。
//下载镜像
docker pull google/cadvisor:latest

//运行容器
docker run -d \
	--volume=/:/rootfs:ro \
	--volume=/var/run:/var/run:rw \
	--volume=/sys:/sys:ro \
	--volume=/var/lib/docker/:/var/lib/docker:ro \
	--publish=8080:8080 \
	--name=cadvisor \
	google/cadvisor:latest
cAdvisor提供一些运行时参数供用户配置使用:
4个--volume挂载操作不能省略,如果不挂载,将无法连接到Docker deamon,ro表示只读。
--detach操作是为了在创建后不进入容器内部,让其自动完成监视功能。
在Ret Hat/CentOS/Fedora等发行版上需要传递privileged参数,因为SELinux加强了安全策略:--privileged=true。
--storage_duration保存在内存中的数据时间段长度,默认为2min,即保存2分钟的数据。
--allow_dynamic_housekeeping依据容器的活跃程度,动态调整读取容器监控数据的时间间隔。
--global_housekeeping_interval检测是否有新增容器的时间周期。
--housekeeping_interval统计每个容器数据的时间周期,默认每秒取1次数据,取统计到的最近的60个数据。
启动后cAdvisor立即开始监控,可以浏览主机上的端口8080查看cAdvisor的Web接口,确认它是可操作的。可以访问/metric页面查看监控指标。
cAdvisor支持的Prometheus的指标主要有五大类(62个),包括CPU(10个)、内存(9个)、文件(18个)、网络(12个)、其他容器状态(13个),具体指标说明可以参考:https://github.com/google/cadvisor/blob/master/docs/storage/prometheus.md。
cAdvisor通过存储插件(cAdvisor Storage Plugins)把状态信息输出到InfluxDB数据库进行存储、读取或KAfka等,通过-storage_driver来配置,具体支持的存储项有:BigQuery、ElasticSearch、InfluxDB、Kafka、Prometheus、Redis、StatsD以及stdout标准输出等。详见官网文档:https://github.com/google/cadvisor/tree/master/docs/storage。
集成到Prometheus
cAdvisor采集的监控数据通过http://localhost:8080/metrics展现给Prometheus。
修改/etc/prometheus/prometheus.yml,将cAdvisor添加到监控数据采集任务目标当中:
 - job_name: 'cadvisor'
   static_configs:
   - targets: ['localhost:8080']
   	 labels:
   	 	instance: server
常用的docker监控指标
触发器配置
由于之前的触发器是全部写在了一个yml里面就是alert.yam,这样随着后面配置的触发器越来越多最终会变得难以维护.这里我们让它去读rules目录下所有的yml文件即可
Prometheus配置
rule_files:
	- "alert.yml"
	- "rules/*.yml"
vim prometheus/rules/docker.yml
groups:
- name: DockerContainers
rules:
- alert: ContainerKilled
expr: time() - container_last_seen >60
for: 0m
labels:
severity: warning
annotations:
summary: "Docker容器被杀死,容器:$labels.instance"
description: "{{ $value }}个容器消失了"
- alert: ContainerAbsent
expr: absent(container_last_seen)
for: 5m
labels:
severity: warning
annotations:
summary: "无容器 容器:{{$labels.instance }}"
description: "5分钟检查容器不存在,当前值为:{{ $value }}"
- alert: ContainerCpuUsage
expr: (sum(rate(container_cpu_usage_seconds_total{name!=""}[3m])) BY(instance, name)*100 ) > 300
for: 2m
labels:
severity: warning
annotations:
summary: "容器cpu使用率告警,容器:{{$labels.instance }}"
description: "容器cpu使用率超过300%,当前值为:{{ $value }}"
- alert: ContainerMemoryUsage
expr: (sum(container_memory_working_set_bytes{name!=""})BY (instance, name) /sum(container_spec_memory_limit_bytes > 0) BY (instance, name) * 100 ) > 80
for: 2m
labels:
severity: warning
annotations:
summary: "容器内存使用率告警,容器:{{$labels.instance }}"
description: "容器内存使用率超过80%,当前值为:{{ $value }}"
- alert: ContainerVolumeIOUsage
expr: (sum(container_fs_io_current{name!=""}) BY (instance, name) * 100) >80
for: 2m
labels:
severity: warning
annotations:
summary: "容器存储IO使用率告警,容器:{{$labels.instance }}"
description: "容器存储IO使用率超过80%,当前值为:{{ $value }}"
- alert: ContainerHighThrottleRate
expr: rate(container_cpus_cfs_throttled_seconds_total[3m]) > 1
for: 2m
labels:
severity: warning
annotations:
summary: "容器限制告警,容器:{{$labels.instance }}"
description: "容器被限制,当前值为:{{ $value }}"这里在grafana中搜索id=11600的仪表盘模板
id=11600
监控mysql8.0
卸载MySQL
1.1.检查是否安装
rpm -qa | grep mysql
1
1.2.如已安装mysql,则删除
rpm -e --nodeps +包名
1
1.3.再次检查安装包是否全部删除
1.4.搜索mysql文件夹
find / -name mysql
1
1.5.若有mysql文件夹,则删除
rm -rf +包名
1
1.6.再次检查文件夹是否全部删除
下载MySQL安装包
官方网址:https://downloads.mysql.com/archives/community/
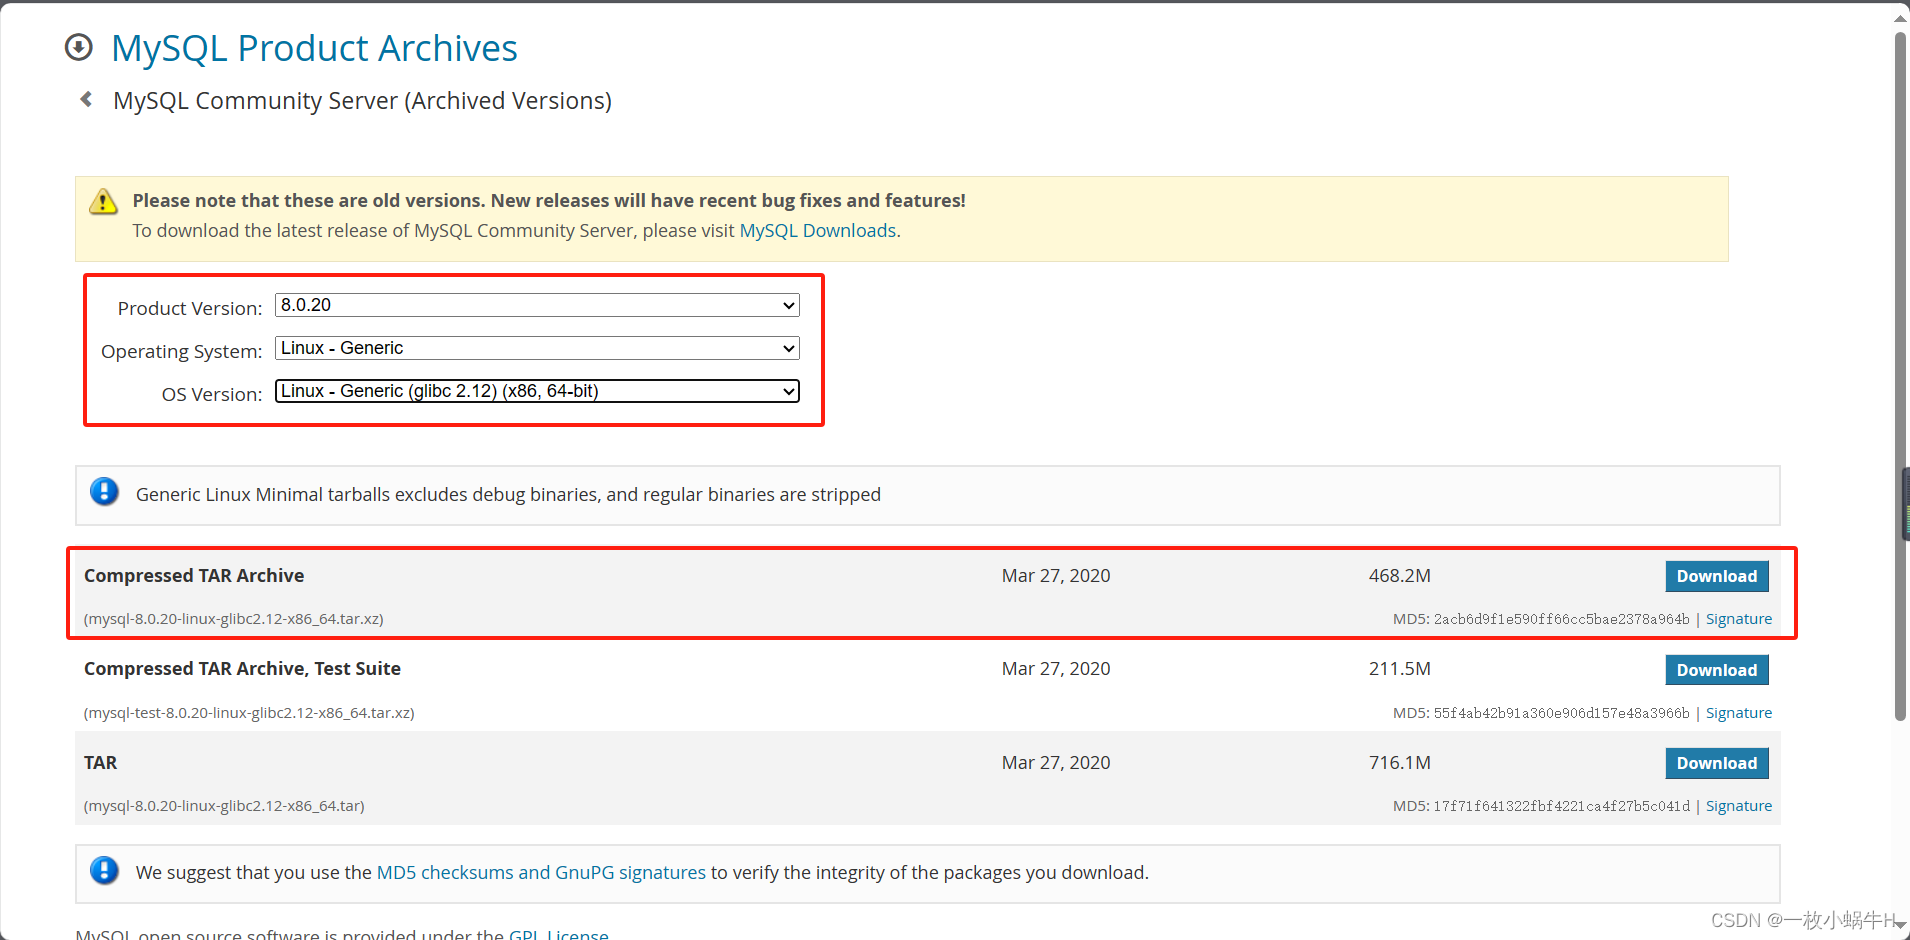
wget https://downloads.mysql.com/archives/get/p/23/file/mysql-8.0.36-linux-glibc2.17-x86_64.tar.xz2.1.上传到服务器目录
2.2.解压
tar -xf mysql-8.0.20-linux-glibc2.12-x86_64.tar.xz
文件夹重命名为mysql,移动位置并重新命名
mv mysql-8.0.20-linux-glibc2.12-x86_64 /usr/local/mysq.创建mysql用户组和用户并修改权限
groupadd mysql 	#创建一个新的用户组,名为“mysql”
useradd -r -g mysql mysql 	#创建一个新的用户,也名为“mysql”
12
2.4.创建目录并赋予权限
mkdir -p  /data/mysql              #创建目录
chown mysql:mysql -R /data/mysql   #赋予权限
配置my.cnf文件
新增my.cnf文件(没有就手动新建) 配置内容如下:
[mysqld]
bind-address=0.0.0.0
port=3306
user=mysql
basedir=/usr/local/mysql
datadir=/data/mysql
socket=/tmp/mysql.sock
log-error=/data/mysql/mysql.err
pid-file=/data/mysql/mysql.pid
#character config
character_set_server=utf8mb4
symbolic-links=0
explicit_defaults_for_timestamp=true
初始化数据库
2.6.1.进入bin目录下
cd usr/local/mysql/bin/初始化
./mysqld --defaults-file=/etc/my.cnf --basedir=/usr/local/mysql/ --datadir=/data/mysql/ --user=mysql --initialize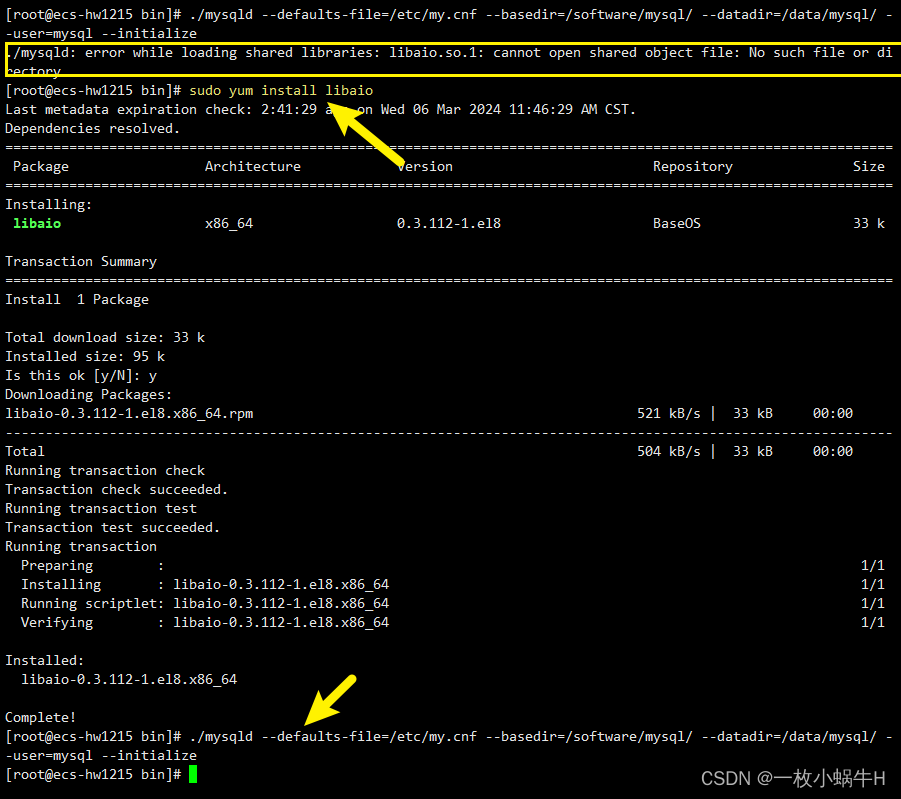
这个错误信息表明,mysqld 进程在尝试加载 libaio.so.1 这个共享库文件时失败了,因为系统找不到这个文件。libaio(异步I/O库)是MySQL在某些操作系统上需要的依赖库之一。
要解决这个问题,你需要安装 libaio 库。这通常可以通过你的操作系统的包管理器来完成。以下是一些常见Linux发行版的安装命令:
sudo yum install libaio
1
2.6.3.查看密码
cat /data/mysql/mysql.err
1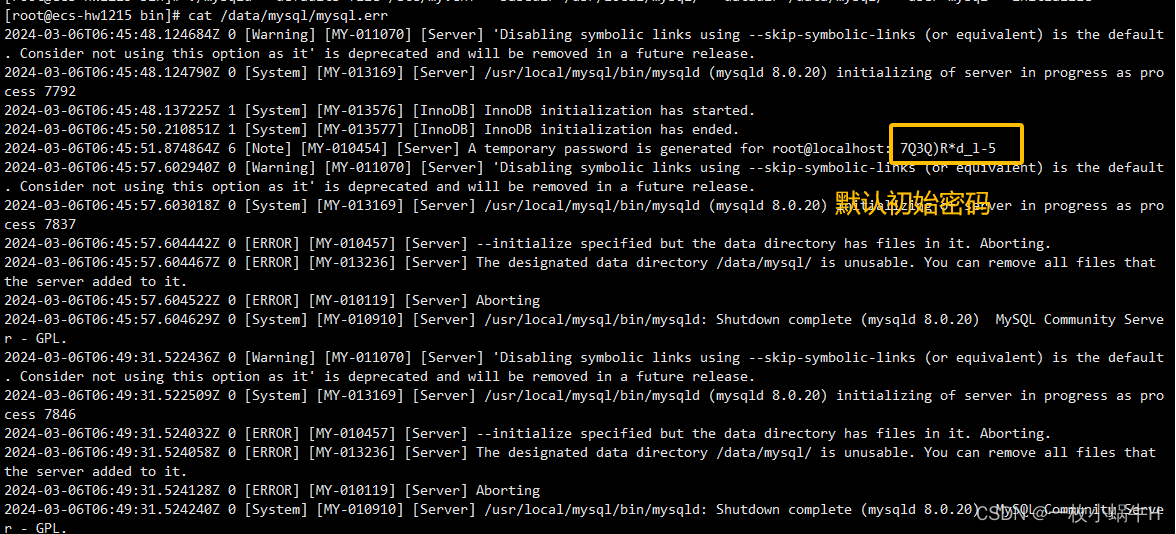
2.6.4.将mysql.server放置到/etc/init.d/mysql中
cp /usr/local/mysql/support-files/mysql.server /etc/init.d/mysql
1
将 mysql.server 脚本放置到 /etc/init.d/mysql 目录中的主要作用是使得你可以使用标准的系统服务管理工具来管理 MySQL 服务。在 Linux 系统中,/etc/init.d/ 目录存放的是一系列系统服务的管理(启动、停止等)脚本。 mysql.server 是一个官方针对 Unix 和类 Unix 系统二进制版本安装包中包含的脚本,它主要用于启动、查看和停止 mysqld 进程服务。当 mysql.server 脚本被放置在 /etc/init.d/mysql 目录中后,你可以使用 service 命令来管理 MySQL 服务,例如: service mysql start:启动 MySQL 服务。 service mysql stop:停止 MySQL 服务。 service mysql restart:重启 MySQL 服务。 这样,你就可以很方便地通过标准的系统服务管理工具来管理 MySQL 服务了。不过,在实际操作中,你还需要确保 MySQL 的配置文件(如 my.cnf)已经正确设置,并且 MySQL 的数据目录和其他相关目录的权限和所有权设置也是正确的。
2.6.5.启动
#启动
service mysql start
#查询
ps -ef|grep mysql

12345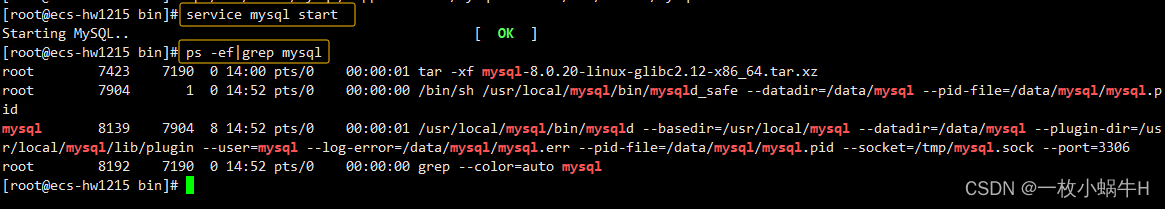
2.6.6.设置mysql环境变量
export PATH=$PATH:/usr/local/mysql/bin
1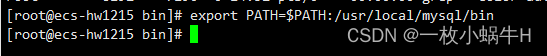
/etc/profile 在最后添加一行:
export PATH=$PATH:/usr/local/mysql/bin
1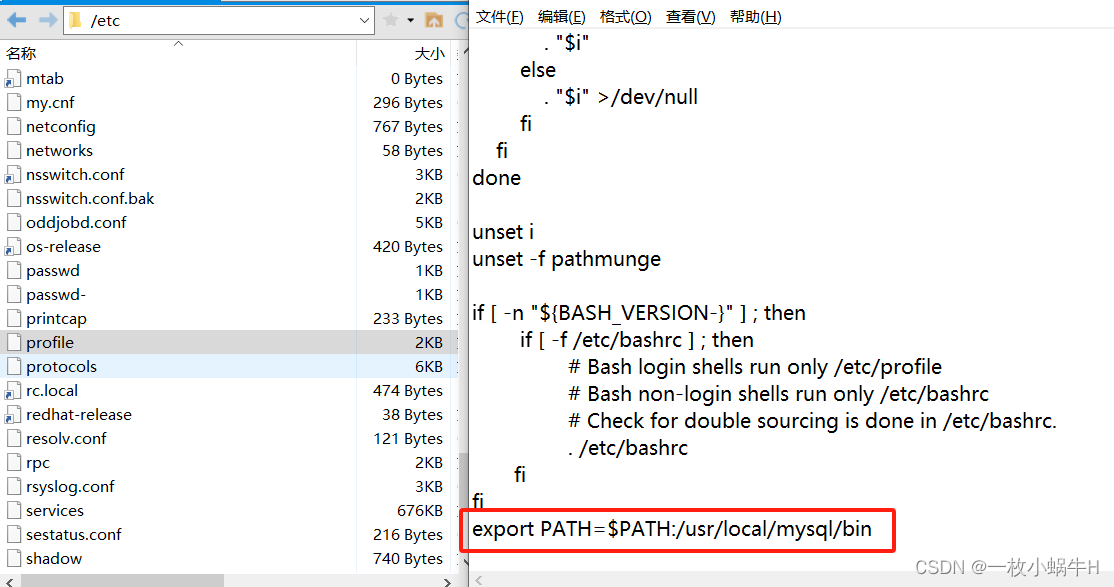
刷新配置:source /etc/profile
检查环境,确认 MySQL 及其工具是否已经安装在你的系统上
whereis mysql;
whereis mysqldump;
12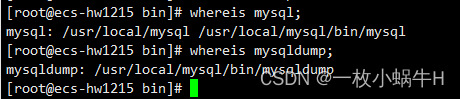
配置MySQL
3.1.成功进入
mysql -u root -p设置密码
设置
ALTER USER 'root'@'localhost' IDENTIFIED WITH mysql_native_password BY '@root123456';
1
刷新
flush privileges;安装配置mysqld-exporter
下载mysqld插件,更多插件见promethues插件相关地址。下载完成后解压mysqld_exporter-0.13.0.linux-amd64.tar.gz
wget https://github.com/prometheus/mysqld_exporter/releases/download/v0.15.1/mysqld_exporter-0.15.1.linux-amd64.tar.gz配置mysql-exporter
在mysqld-exporter安装路径下,创建.my.cnf文件。内容如下:
[client]
user=mysql_monitor
password=123.com
host=localhost
port=3306
创建mysql 用户并授权
CREATE USER 'mysql_monitor'@'localhost' IDENTIFIED BY '123.com' WITH MAX_USER_CONNECTIONS 3;
GRANT PROCESS, REPLICATION CLIENT, SELECT ON *.* TO 'mysql_monitor'@'localhost';
FLUSH PRIVILEGES;
EXIT
[Unit]
Description=mysqld_exporter
[Service]
User=root
ExecStart=/usr/local/mysql_exporter/mysqld_exporter --config.my-cnf /usr/local/mysql_exporter/.my.cnf --web.listen-address=0.0.0.0:9104 \
--collect.slave_status \
--collect.binlog_size \
--collect.info_schema.processlist \
--collect.info_schema.innodb_metrics \
--collect.engine_innodb_status \
--collect.perf_schema.file_events \
--collect.perf_schema.replication_group_member_stats
Restart=on-failure
[Install]
WantedBy=multi-user.target
# 通知systemd重新加载配置文件
systemctl daemon-reload
#启动
systemctl start mysqld_exporter
#设置开机自启动
systemctl enable mysqld_exporter
#查看状态
systemctl status mysqld_exporter添加监控目标
vi /usr/local/prometheus/prometheus.yml

  - job_name: 'MySQL'
    static_configs:
    - targets: ['192.168.10.11:9104']
      labels:
        instance: mysql_Prometheus

systemctl restart prometheus
systemctl status prometheus
触发器
groups:
- name: MySQLStatsAlert
  rules:
  - alert: MySQL is down
    expr: mysql_up == 0
    for: 1m
    labels:
      severity: critical
    annotations:
      summary: "Instance {{ $labels.instance }} MySQL is down"
      description: "MySQL database is down. This requires immediate action!"
  - alert: open files high
    expr: mysql_global_status_innodb_num_open_files > (mysql_global_variables_open_files_limit) * 0.75
    for: 1m
    labels:
      severity: warning
    annotations:
      summary: "Instance {{ $labels.instance }} open files high"
      description: "Open files is high. Please consider increasing open_files_limit."
  - alert: Read buffer size is bigger than max. allowed packet size
    expr: mysql_global_variables_read_buffer_size > mysql_global_variables_slave_max_allowed_packet
    for: 1m
    labels:
      severity: warning
    annotations:
      summary: "Instance {{ $labels.instance }} Read buffer size is bigger than max. allowed packet size"
      description: "Read buffer size (read_buffer_size) is bigger than max. allowed packet size (max_allowed_packet).This can break your replication."
  - alert: Sort buffer possibly missconfigured
    expr: mysql_global_variables_innodb_sort_buffer_size <256*1024 or mysql_global_variables_read_buffer_size > 4*1024*1024
    for: 1m
    labels:
      severity: warning
    annotations:
      summary: "Instance {{ $labels.instance }} Sort buffer possibly missconfigured"
      description: "Sort buffer size is either too big or too small. A good value for sort_buffer_size is between 256k and 4M."
  - alert: Thread stack size is too small
    expr: mysql_global_variables_thread_stack <196608
    for: 1m
    labels:
      severity: warning
    annotations:
      summary: "Instance {{ $labels.instance }} Thread stack size is too small"
      description: "Thread stack size is too small. This can cause problems when you use Stored Language constructs for example. A typical is 256k for thread_stack_size."
  - alert: Used more than 80% of max connections limited
    expr: mysql_global_status_max_used_connections > mysql_global_variables_max_connections * 0.8
    for: 1m
    labels:
      severity: warning
    annotations:
      summary: "Instance {{ $labels.instance }} Used more than 80% of max connections limited"
      description: "Used more than 80% of max connections limited"
  - alert: InnoDB Force Recovery is enabled
    expr: mysql_global_variables_innodb_force_recovery != 0
    for: 1m
    labels:
      severity: warning
    annotations:
      summary: "Instance {{ $labels.instance }} InnoDB Force Recovery is enabled"
      description: "InnoDB Force Recovery is enabled. This mode should be used for data recovery purposes only. It prohibits writing to the data."
  - alert: InnoDB Log File size is too small
    expr: mysql_global_variables_innodb_log_file_size < 16777216
    for: 1m
    labels:
      severity: warning
    annotations:
      summary: "Instance {{ $labels.instance }} InnoDB Log File size is too small"
      description: "The InnoDB Log File size is possibly too small. Choosing a small InnoDB Log File size can have significant performance impacts."
  - alert: InnoDB Flush Log at Transaction Commit
    expr: mysql_global_variables_innodb_flush_log_at_trx_commit != 1
    for: 1m
    labels:
      severity: warning
    annotations:
      summary: "Instance {{ $labels.instance }} InnoDB Flush Log at Transaction Commit"
      description: "InnoDB Flush Log at Transaction Commit is set to a values != 1. This can lead to a loss of commited transactions in case of a power failure."
  - alert: Table definition cache too small
    expr: mysql_global_status_open_table_definitions > mysql_global_variables_table_definition_cache
    for: 1m
    labels:
      severity: page
    annotations:
      summary: "Instance {{ $labels.instance }} Table definition cache too small"
      description: "Your Table Definition Cache is possibly too small. If it is much too small this can have significant performance impacts!"
  - alert: Table open cache too small
    expr: mysql_global_status_open_tables >mysql_global_variables_table_open_cache * 99/100
    for: 1m
    labels:
      severity: page
    annotations:
      summary: "Instance {{ $labels.instance }} Table open cache too small"
      description: "Your Table Open Cache is possibly too small (old name Table Cache). If it is much too small this can have significant performance impacts!"
  - alert: Thread stack size is possibly too small
    expr: mysql_global_variables_thread_stack < 262144
    for: 1m
    labels:
      severity: page
    annotations:
      summary: "Instance {{ $labels.instance }} Thread stack size is possibly too small"
      description: "Thread stack size is possibly too small. This can cause problems when you use Stored Language constructs for example. A typical is 256k for thread_stack_size."
  - alert: InnoDB Buffer Pool Instances is too small
    expr: mysql_global_variables_innodb_buffer_pool_instances == 1
    for: 1m
    labels:
      severity: page
    annotations:
      summary: "Instance {{ $labels.instance }} InnoDB Buffer Pool Instances is too small"
      description: "If you are using MySQL 5.5 and higher you should use several InnoDB Buffer Pool Instances for performance reasons. Some rules are: InnoDB Buffer Pool Instance should be at least 1 Gbyte in size. InnoDB Buffer Pool Instances you can set equal to the number of cores of your machine."
  - alert: InnoDB Plugin is enabled
    expr: mysql_global_variables_ignore_builtin_innodb == 1
    for: 1m
    labels:
      severity: page
    annotations:
      summary: "Instance {{ $labels.instance }} InnoDB Plugin is enabled"
      description: "InnoDB Plugin is enabled"
  - alert: Binary Log is disabled
    expr: mysql_global_variables_log_bin != 1
    for: 1m
    labels:
      severity: warning
    annotations:
      summary: "Instance {{ $labels.instance }} Binary Log is disabled"
      description: "Binary Log is disabled. This prohibits you to do Point in Time Recovery (PiTR)."
  - alert: Binlog Cache size too small
    expr: mysql_global_variables_binlog_cache_size < 1048576
    for: 1m
    labels:
      severity: page
    annotations:
      summary: "Instance {{ $labels.instance }} Binlog Cache size too small"
      description: "Binlog Cache size is possibly to small. A value of 1 Mbyte or higher is OK."
  - alert: Binlog Statement Cache size too small
    expr: mysql_global_variables_binlog_stmt_cache_size <1048576 and mysql_global_variables_binlog_stmt_cache_size > 0
    for: 1m
    labels:
      severity: page
    annotations:
      summary: "Instance {{ $labels.instance }} Binlog Statement Cache size too small"
      description: "Binlog Statement Cache size is possibly to small. A value of 1 Mbyte or higher is typically OK."
  - alert: Binlog Transaction Cache size too small
    expr: mysql_global_variables_binlog_cache_size  <1048576
    for: 1m
    labels:
      severity: page
    annotations:
      summary: "Instance {{ $labels.instance }} Binlog Transaction Cache size too small"
      description: "Binlog Transaction Cache size is possibly to small. A value of 1 Mbyte or higher is typically OK."
  - alert: Sync Binlog is enabled
    expr: mysql_global_variables_sync_binlog == 1
    for: 1m
    labels:
      severity: page
    annotations:
      summary: "Instance {{ $labels.instance }} Sync Binlog is enabled"
      description: "Sync Binlog is enabled. This leads to higher data security but on the cost of write performance."
  - alert: IO thread stopped
    expr: mysql_slave_status_slave_io_running != 1
    for: 1m
    labels:
      severity: critical
    annotations:
      summary: "Instance {{ $labels.instance }} IO thread stopped"
      description: "IO thread has stopped. This is usually because it cannot connect to the Master any more."
  - alert: SQL thread stopped
    expr: mysql_slave_status_slave_sql_running == 0
    for: 1m
    labels:
      severity: critical
    annotations:
      summary: "Instance {{ $labels.instance }} SQL thread stopped"
      description: "SQL thread has stopped. This is usually because it cannot apply a SQL statement received from the master."
  - alert: SQL thread stopped
    expr: mysql_slave_status_slave_sql_running != 1
    for: 1m
    labels:
      severity: critical
    annotations:
      summary: "Instance {{ $labels.instance }} Sync Binlog is enabled"
      description: "SQL thread has stopped. This is usually because it cannot apply a SQL statement received from the master."
  - alert: Slave lagging behind Master
    expr: rate(mysql_slave_status_seconds_behind_master[1m]) >30
    for: 1m
    labels:
      severity: warning
    annotations:
      summary: "Instance {{ $labels.instance }} Slave lagging behind Master"
      description: "Slave is lagging behind Master. Please check if Slave threads are running and if there are some performance issues!"
  - alert: Slave is NOT read only(Please ignore this warning indicator.)
    expr: mysql_global_variables_read_only != 0
    for: 1m
    labels:
      severity: page
    annotations:
      summary: "Instance {{ $labels.instance }} Slave is NOT read only"
      description: "Slave is NOT set to read only. You can accidentally manipulate data on the slave and get inconsistencies..."
grafana-id
7362
9625
11074这个是node的
监控进程
mkdir -pv /usr/local/process_exporter
cd /usr/local/process_exporter
cat >>process.yml<< 'EOF'
process_names:
  - name: "{{ .Comm}}" #匹配模板
    cmdline:
    - '.+' #匹配所有名称
EOF
cat >>process.yml<< 'EOF'
process_names:
# - name: "{{ .Comm}}" #匹配模板
# cmdline:
# - '.+' #匹配所有名称
- name: "{{.Matches}}"
cmdline:
- 'mongod'
- name: "{{.Matches}}"
cmdline:
- 'mysqld'
- name: "{{.Matches}}"
cmdline:
- 'nginx' #唯一标识
- name: "{{.Matches}}"
cmdline:
- 'redis-server'
EOFprocess-exporter使用
1.1 下载 process-exporter
process-exporter GibHUB地址 process-exporter 下载地址
process-exporter可以使用命令行参数也可以指定配置文件启动
vim /usr/lib/systemd/system/process_exporter.service

vi /usr/lib/system/system/process-exporter.service
[Unit]
Description=process_exporter
After=network.target

[Service]
User=root
Type=simple
ExecStart=/usr/local/process_exporter/process-exporter -config.path /usr/local/process_exporter/process.yml
Restart=on-failure

[Install]
WantedBy=multi-user.target
启动 procexx-export
systemctl daemon-reload
systemctl start process_exporter
systemctl enable process_exporter
验证监控数据
curl http://localhost:9256/metrics配置Prometheus 在原prometheus.yml的末端添加下面配置
  - job_name: 'process'
    static_configs:
    - targets: ['192.168.10.11:9256']
常用指数
添加触发器
cat > prometheus/rules/process.yml <<"EOF"
groups:
- name: process
  rules:
  - alert: 进程数多告警
    expr: sum(namedprocess_namegroup_states) by (instance) > 1000
    for: 1m
    labels:
      severity: warning
    annotations:
      summary: "进程数超过1000"
      description: "服务器当前有{{ $value }}个进程"
  - alert: 僵尸进程数告警
    expr: sum by(instance, groupname) (namedprocess_namegroup_states{state="Zombie"}) > 0
    for: 1m
    labels:
      severity: warning
    annotations:
      summary: "有僵尸进程数"
      description: "进程{{ $labels.groupname }}有{{ $value }}个僵尸进程"
  - alert: 进程重启告警
    expr: ceil(time() - max by(instance, groupname) (namedprocess_namegroup_oldest_start_time_seconds)) < 60
    for: 15s
    labels:
      severity: warning
    annotations:
      summary: "进程重启"
      description: "进程{{ $labels.groupname }}在{{ $value }}秒前重启过"
  - alert: 进程退出告警
    expr: max by(instance, groupname) (delta(namedprocess_namegroup_oldest_start_time_seconds{groupname=~"^java.*|^nginx.*"}[1d])) < 0
    for: 1m
    labels:
      severity: warning
    annotations:
      summary: "进程退出"
      description: "进程{{ $labels.groupname }}退出了"
  - alert: 进程打开文件描述符告警
    expr: namedprocess_namegroup_worst_fd_ratio * 100 > 80
    for: 1m
    labels:
      severity: warning
    annotations:
      summary: "进程打开文件描述符过高"
      description: "进程{{ $labels.groupname }},打开文件描述符过高"
EOF
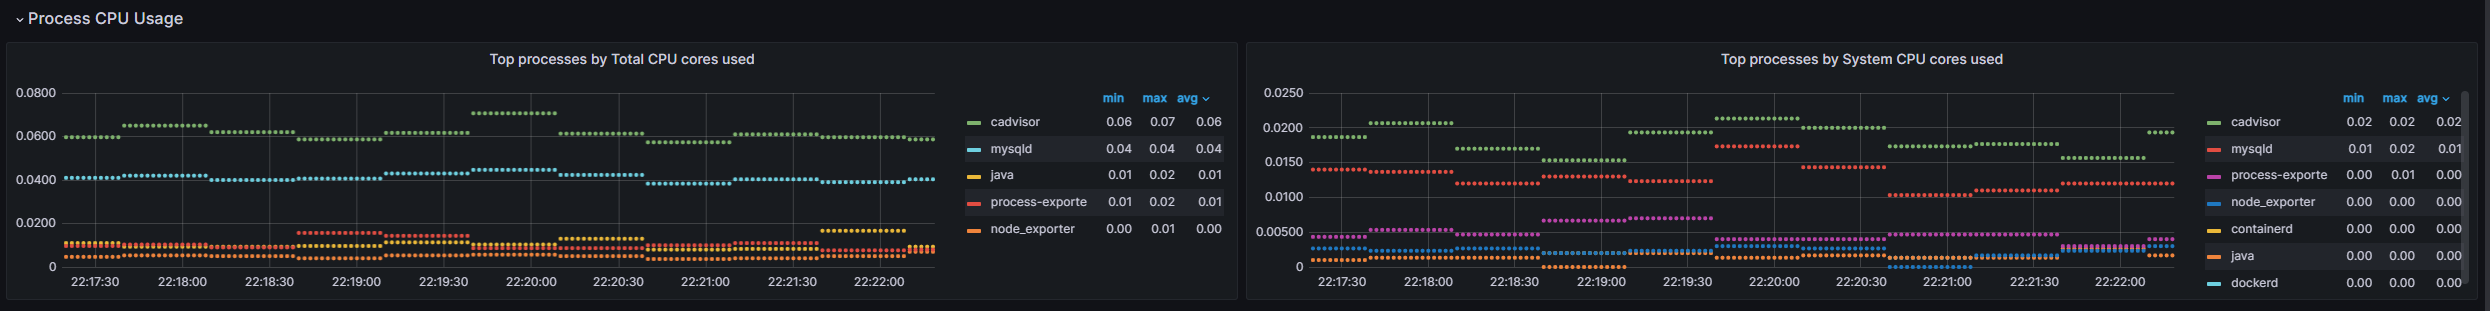
4.Grafana Dashboard图形化
https://grafana.com/grafana/dashboards/8378-system-processes-metrics/
Top processes by Total CPU cores used 和 Top processes by System CPU cores used 图形显示不正常
process-exporter 升级到 0.5.0后 ,namedprocess_namegroup_cpu_user_seconds_total和namedprocess_namegroup_cpu_system_seconds_total合为一个指标名namedprocess_namegroup_cpu_seconds_total
namedprocess_namegroup_cpu_user_seconds_tota`l变成`namedprocess_namegroup_cpu_seconds_total{mode="system"}
namedprocess_namegroup_cpu_system_seconds_total`变成`namedprocess_namegroup_cpu_seconds_total{mode="user"}解决方法:
Top processes by System CPU cores used图形修改如下:
topk(5,
rate(namedprocess_namegroup_cpu_seconds_total{mode="system",groupname=~"$processes",instance=~"$host"}[$interval])
or
(
irate(namedprocess_namegroup_cpu_seconds_total{mode="system",groupname=~"$processes",instance=~"$host"}[5m])))
Top processes by Total CPU cores used图形修改如下:
topk(5,sum by (groupname,instance) (rate(namedprocess_namegroup_cpu_seconds_total{groupname=~"$processes",instance=~"$host"}[$interval]))
or
sum by (groupname,instance) (irate(namedprocess_namegroup_cpu_seconds_total{groupname=~"$processes",instance=~"$host"}[5m])))或者图形改名为:Top processes by User CPU cores used 用户进程cpu使用率排名
topk(5,
rate(namedprocess_namegroup_cpu_seconds_total{mode="user",groupname=~"$processes",instance=~"$host"}[$interval])
or
(
irate(namedprocess_namegroup_cpu_seconds_total{mode="user",groupname=~"$processes",instance=~"$host"}[5m])))
修改完成后可以显示了
黑盒监控
“白盒监控” 是需要把对应的Exporter程序安装到被监控的目标主机上,从而实现对主机各种资源以及状态的数据采集工作 ”黑盒监控“ 是不需要把Exporter程序部署到被监控的目标主机上,比如全球的网络质量的稳定性,通常用ping操作,对选取的节点进行icmp测试 Prometheus社区提供黑盒解决方案,用户只需要将其安装在与Prometheus和被监控目标互通的环境中,通过HTTP、HTTPS、DNS、TCP、ICMP,证书的监控等 方式对网络进行探测监控。
blackbox_exporter
Prometheus 官方提供的exporter,可以提供http dns tcp icmp的监控数据采集
blackbox_exporter下载地址:https://prometheus.io/download/
1)安装blackbox_exporter #上传软件
[root@localhost opt] ll blackbox_exporter-0.16.0.linux-amd64.tar.gz
-rw-r--r--. 1 root root 8314959 May 18 20:40 blackbox_exporter-0.16.0.linux-amd64.tar.gz
[root@localhost opt] tar -zxvf blackbox_exporter-0.16.0.linux-amd64.tar.gz
[root@localhost opt] cp -r blackbox_exporter-0.16.0.linux-amd64 /usr/local/blackbox_exporter
1234
2)添加blackbox_exporter为系统服务开机启动配置文件blackbox_exporter.service
[root@localhost ~] vi /usr/lib/systemd/system/blackbox_exporter.service
1
[Unit]
Description=blackbox_exporter
After=network.target

[Service]
Type=simple
User=root
Group=root
ExecStart=/usr/local/blackbox_exporter/blackbox_exporter \
    --config.file=/usr/local/blackbox_exporter/blackbox.yml \
    --web.listen-address=:9115
Restart=on-failure

[Install]
WantedBy=multi-user.target
123456789101112131415
[root@localhost ~] systemctl daemon-reload
[root@localhost ~] systemctl restart blackbox_exporter
[root@localhost ~] netstat -tlunp | grep blackbox_expo
tcp6       0      0 :::9115              :::*              LISTEN      11925/blackbox_expo
创建配置文件
cat >/data/blackbox_exporter/blackbox.yml <<'EOF'
modules:
  http_2xx:
    prober: http
    http:
      method: GET
  http_port_2xx:
    prober: http
    http:
      method: POST
  tcp_connect:
    prober: tcp
  pop3s_banner:
    prober: tcp
    tcp:
      query_response:
      - expect: "^+OK"
      tls: true
      tls_config:
        insecure_skip_verify: false
  grpc:
    prober: grpc
    grpc:
      tls: true
      preferred_ip_protocol: "ip4"
  grpc_plain:
    prober: grpc
      tls: false
      service: "service1"
  ssh_banner:
    prober: tcp
    tcp:
      query_response:
      - expect: "^SSH-2.0-"
      - send: "SSH-2.0-blackbox-ssh-check"
  irc_banner:
    prober: tcp
    tcp:
      query_response:
      - send: "NICK prober"
      - send: "USER prober prober prober :prober"
      - expect: "PING :([^ ]+)"
        send: "PONG ${1}"
      - expect: "^:[^ ]+ 001"
  icmp:
    prober: icmp
  icmp_ttl5:
    prober: icmp
    timeout: 5s
    icmp:
      ttl: 5
EOF
修改后
root@prometheus220:/data/blackbox_exporter# cat /data/blackbox_exporter/config.yml
modules:
  http_2xx:
    prober: http
    http:
      method: GET
  http_port_2xx:
    prober: http
    http:
      method: POST
  tcp_connect:
    prober: tcp
  icmp:
    prober: icmp
添加Prometheus的配置
cat >> prometheus/prometheus.yml<<'EOF'
#http 配置
- job_name: 'blackbox_http'
metrics_path: /probe
params:
module: [http_2xx]
static_configs:
- targets:
- https://www.baidu.com
- https://www.163.com
relabel_configs:
- source_labels: [__address__]
target_label: __param_target
- source_labels: [__param_target]
target_label: instance
- target_label: __address__
replacement: 192.168.10.10:9115
#tcp 配置
- job_name: 'blackbox_tcp'
metrics_path: /probe
params:
module: [tcp_connect]
static_configs:
- targets:
- 192.168.10.11:22
- 192.168.10.10:9090
relabel_configs:
- source_labels: [__address__]
target_label: __param_target
- source_labels: [__param_target]
target_label: instance
- target_label: __address__
replacement: 192.168.10.10:9115
#icmp 配置 ping
- job_name: 'blackbox_icmp'
metrics_path: /probe
params:
module: [icmp]
static_configs:
- targets:
- 192.168.10.10
- 192.168.10.11
relabel_configs:
- source_labels: [__address__]
target_label: __param_target
- source_labels: [__param_target]
target_label: instance
- target_label: __address__
replacement: 192.168.10.10:9115
EOF监控项:
probe_
probe_success #是否探测成功(取值1、0,分别表示成功、失败)
probe_duration_seconds #探测的耗时
#关于DNS
probe_dns_lookup_time_seconds #DNS解析的耗时
probe_ip_protocol #IP协议取值为4、6
probe_ip_addr_hash #IP地址的哈希值,用于判断IP是否变化
#关于HTTP
probe_http_status_code #HTTP响应的状态码,如果发生重定向,则取决于最后一次响应
probe_http_content_length #HTTP响应的body长度,单位bytes
probe_http_version #HTTP响应的协议版本,比如1.1
probe_http_ssl #HTTP响应是否采用SSL,取值 1、0
probe_ssl_earliest_cert_expiry #SSL证书过期时间,为Unix时间戳
创建触发器文件
cat > prometheus/rules/blackbox_exporter.yml << 'EOF'
groups:
- name: Blackbox
  rules:
  - alert: 黑盒子探测失败报警
    expr: probe_success == 0
    for: 1m
    labels:
      severity: critical
    annotations:
      summary: '黑盒子探测失败 {{ $labels.instance }}'
      description: "黑盒子探测失败,当前值{{ $value }}"
  - alert: 请求慢告警
    expr: avg_over_time(probe_duration_seconds[1m]) > 1
    for: 1m
    labels:
      severity: warning
    annotations:
      summary: '请求慢 {{ $labels.instance }}'
      description: "请求时间操过1秒,值{{ $value }}"
  - alert: http状态码检测失败
    expr: probe_http_status_code <= 199 OR probe_http_status_code >= 400
    for: 1m
    labels:
      severity: critical
    annotations:
      summary: 'http状态码检测失败{{ $labels.instance }}'
      description: "HTTP状态码非200-399,当前状态码为{{ $value }}"
  - alert: ssl证书即将到期
    expr: probe_ssl_earliest_cert_expiry - time() < 86400 *30
    for: 1m
    labels:
      severity: warning
    annotations:
      summary: '证书即将到期 {{ $labels.instance }}'
      description: "SSL 证书在30天后到期,值{{ $value }}"
EOF
grafana
9965
域名过期时间监控
域名的监控通过domain_exporter来完成
domain_exporter:https://github.com/caarlos0/domain_exporter/releases
wget https://github.com/caarlos0/domain_exporter/releases/download/v1.22.0/domain_exporter_1.22.0_linux_amd64.tar.gz

tar zxvf domain_exporter_1.22.0_linux_amd64.tar.gz
mkdir -pv /usr/local/domain_exporter
mv domain_exporter_1.20.2_linux_amd64 /usr/local/domain_exporter

# 创建用户,并给文件夹授权
useradd -M -s /usr/sbin/nologin prometheus
chown prometheus:prometheus -R /usr/local/domain_exporter

#创建systemd服务
cat <<"EOF" >/etc/systemd/system/domain_exporter.service
[Unit]
Description=domain_exporter
After=network.target

[Service]
Type=simple
User=prometheus
Group=prometheus
ExecStart=/usr/local/domin_exporter/domain_exporter
Restart=on-failure

[Install]
WantedBy=multi-user.target
EOF

# 启动
systemctl daemon-reload
systemctl start domain_exporter
systemctl enable domain_exporter
2.2 docker安装方式
docker run -d --restart=always --name domain_exporter -p 9222:9222 caarlos0/domain_exporter3.Prometheus设置
cat >> prometheus/prometheus.yml <<"EOF"
  - job_name: domain
    #scrape_interval: 1h
    scrape_interval: 15s
    metrics_path: /probe
    relabel_configs:
      - source_labels: [__address__]
        target_label: __param_target
      - target_label: __address__
        replacement: 192.168.10.11:9222 # domain_exporter address
    static_configs:
      - targets:
        - qq.com
        - baidu.cn
        - anygts.top
EOF

# 重新加载配置
curl -X POST http://localhost:9090/-/reload

# 检查
http://192.168.10.100:9222/
http://192.168.10.14:9090/targets?search=
3.1 常用监控项目
domain_expiry_days     域名到期时间
domain_probe_success   域名检测状态
4.domain触发器(告警规则)
cat >> prometheus/rules/domain.yml <<"EOF"
groups:
- name: domain
  rules:
  - alert: 域名检测失败
    expr: domain_probe_success == 0
    for: 2h
    labels:
      severity: warning
    annotations:
      summary: '{{ $labels.instance }}'
      description: '{{ $labels.domain }}域名检测失败'
  - alert: 域名过期
    expr: domain_expiry_days < 30
    for: 2h
    labels:
      severity: warning
    annotations:
      summary: '{{ $labels.instance }}'
      description: '{{ $labels.domain }}将在30天后过期'
  - alert: 域名过期
    expr: domain_expiry_days < 5
    for: 2h
    labels:
      severity: page
    annotations:
      summary: '{{ $labels.instance }}'
      description: '{{ $labels.domain }}将在5天后过期'
EOF
重新加载配置:
curl -X POST http://localhost:9090/-/reload
检查:
http://192.168.10.14:9090/rules
http://192.168.10.14:9090/alerts?search=
4.grafana dashboard图形展示
https://grafana.com/grafana/dashboards/14605
id14605显示域名不正确,需要修改
找到右边的Column Styles,在找到“域名”这列,把instance修改为domain
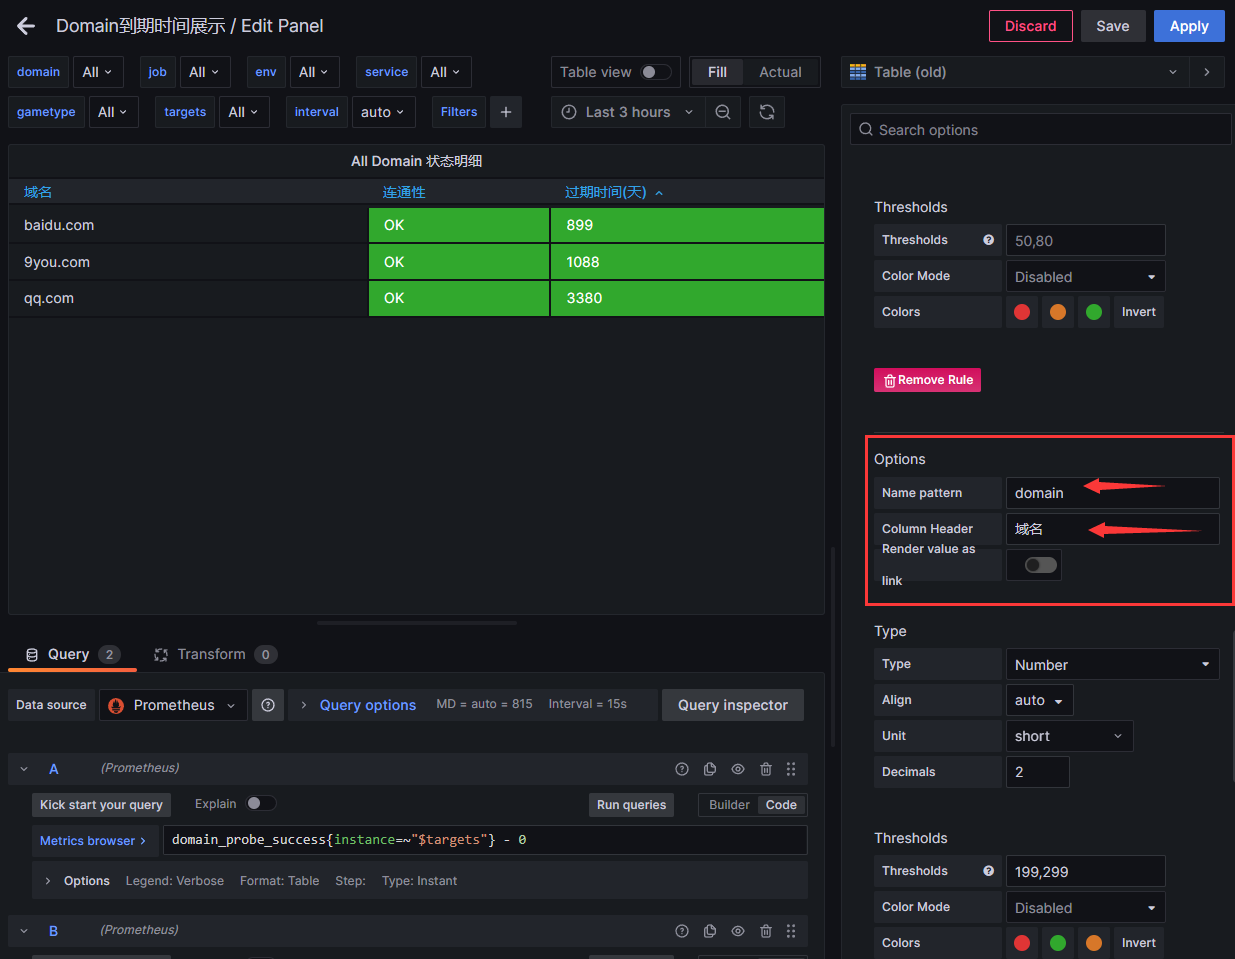
https://grafana.com/grafana/dashboards/13924-9116-domain/
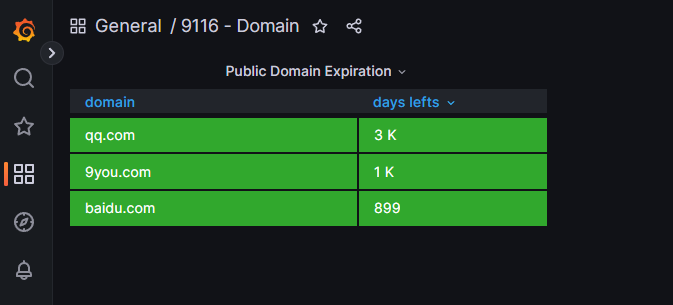
Pushgateway简介
P用它的原因主要是:
Prometheus 采用 pull 模式,可能由于不在一个子网或者防火墙原因,导致 Prometheus 无法直接拉取各个 target 数据。
在监控业务数据的时候,需要将不同数据汇总, 由 Prometheus 统一收集。
由于以上原因,不得不使用 pushgateway,但在使用之前,有必要了解一下它的一些弊端:
将多个节点数据汇总到 pushgateway, 如果 pushgateway 挂了,受影响比多个 target 大。
Prometheus 拉取状态
up只针对 pushgateway, 无法做到对每个节点有效。Pushgateway 可以持久化推送给它的所有监控数据。
因此,即使你的监控已经下线,prometheus 还会拉取到旧的监控数据,需要手动清理 pushgateway 不要的数据。
wget https://github.com/prometheus/pushgateway/releases/download/v1.9.0/pushgateway-1.9.0.linux-amd64.tar.gz
tar -xf pushgateway-1.9.0.linux-amd64.tar.gz
mv pushgateway-1.9.0.linux-amd64 /usr/local/pushgateway
system管理
启动服务,默认端口为9091,可通过–web.listen-address更改监听端口
root@bj-1:/usr/local# cat /usr/lib/systemd/system/pushgateway.service
[Unit]
Description=Prometheus pushgateway
Requires=network.target remote-fs.target
After=network.target remote-fs.target
[Service]
Type=simple
User=root
Group=root
ExecStart=/usr/local/pushgateway/pushgateway --persistence.file="/usr/local/pushgateway/data/" --persistence.interval=5m #保存时间5分钟
ExecReload=/bin/kill -HUP $MAINPID
KillMode=process
Restart=on-failure
RestartSec=5s
[Install]
WantedBy=multi-user.target
prometheus添加配置
新增job pushgateway
vim /usr/local/prometheus/prometheus.yml
  - job_name: 'pushgateway'
    scrape_interval: 30s
    honor_labels: true  #加上此配置exporter节点上传数据中的一些标签将不会被pushgateway节点的相同标签覆盖
    static_configs:
      - targets: ['192.168.10.10:9091']
        labels:
          instance: pushgateway
数据推送默认格式
们要 Push 数据到 PushGateway 中,可以通过其提供的 API 标准接口来添加, 默认 URL 地址为: http://<ip>:9091/metrics/job/<JOBNAME>{/<LABEL_NAME>/<LABEL_VALUE>},
是必填项,为 job 标签值,后边可以跟任意数量的标签对,
一般我们会添加一个
instance/<INSTANCE_NAME>实例名称标签,来方便区分各个指标。1.1 测试
测试:
[root@localhost ~]# echo "test_metric 123456" | curl --data-binary @- http://192.168.10.10:9091/metrics/job/test_job
[root@localhost ~]#
通过命令删除
如删除 job=“test_job” 组下的所有指标值,可以执行如下命令:
curl -X DELETE http://192.168.156.134:9091/metrics/job/test_job实际操作:
[root@localhost data]# curl -X DELETE http://192.168.156.134:9091/metrics/job/test_job
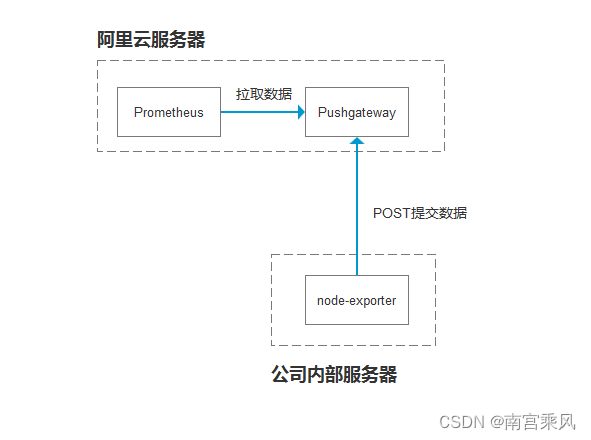
[root@localhost data]# Post推送Node-expoerter组件数据
安装好node_exporter,此处不多介绍 传送监控数据到pushgateway节点 对于传过去的监控项会添加此处定义的标签 job=test instance=10.2.1.11 hostname=ip-10-2-1-11
curl 127.0.0.1:9100/metrics|curl --data-binary @- http://10.3.1.11:9091/metrics/job/test/instance/10.2.1.11/hostname/ip-10-2-1-11编写脚本
node_date.sh
#!/bin/bash
job_name="Bj"
hostname=$(hostname)
HOST_IP=$(hostname --all-ip-addresses | awk '{print $1}')

/usr/bin/curl 127.0.0.1:9100/metrics|/usr/bin/curl --data-binary @- http://sanming.f3322.net:9091/metrics/job/$job_name/instance/$HOST_IP/hostname/$hostname
crontab定时任务
#Ansible: node_date
* * * * * /bin/bash /usr/local/node_exporter/node_date.sh
Ansible剧本
root@bj-1:/opt/node_date# cat playbook.yml
- hosts: all
  remote_user: root
  gather_facts: no
  tasks:
    - name: 推送磁盘脚本
      copy: src=node_date.sh dest=/usr/local/node_exporter mode=u+x
    - name: 设置定时任务
      cron: name="node_date"  job="/bin/bash /usr/local/node_exporter/node_date.sh" state="present"
    - name: 执行脚本
      shell: /bin/bash /usr/local/node_exporter/node_date.sh
基于文件的服务发现
通过自动化的手段将被监控端监控起来,之前是每次都在普罗米修斯的配置文件里面写要监控谁,然后重载一下就生效了。最后就可以在普罗米修斯图形界面这里看到其配置了
如果被监控端的数据量很大的话,每次修改配置文件很复杂也容易出错。自动化的目的就是将预期的被监控端自动的加入监控。不需要人工干预这件事
Prometheus服务发现
Prometheus添加被监控端支持两种方式:
• 静态配置:手动配置 手动的在配置文件里面添加
• 服务发现:动态发现需要监控的Target实例
最常用的就是consul
服务端:
1.修改配置文件
[root@prometheus-server ~]# vim /data/prometheus/prometheus.yml
  - job_name: 'file-node'
    file_sd_configs:
    - refresh_interval: 5s
      files:
      - "/usr/local/prometheus/targets/node/node.yml"

2.创建自动发现所在路径
[root@prometheus-server ~]# mkdir /usr/local/prometheus/targets/node -pv

3.重载配置
[root@prometheus-server ~]# curl -XPOST prometheus-server:9090/-/reload
建自动发现文件
在里面写好自动发现的服务器地址和label标签即可
[root@prometheus-server ~]# vim /data/prometheus/targets/node/node.yml
- targets: ['localhost:9090']
  labels:
    instance: prometheus服务器
    job: prometheus
- targets: ['localhost:9100']
  labels:
    instance: prometheus服务器
    job: Linux
- targets: ['192.168.10.11:9100']
  labels:
    instance: test服务器
    job: Linux
- targets: ['192.168.10.10:9093']
  labels:
    instance: prometheus服务器
    job: alters
- targets: ['192.168.10.11:9113']
  labels:
    instance: test服务器
    job: nginx
- targets: ['192.168.10.11:9121']
  labels:
    instance: test服务器
    job: redis
- targets: ['192.168.10.11:9216']
  labels:
    instance: test服务器
    job: mongodb

- targets: ['localhost:8080']
  labels:
    instance: prometheus服务器
    job: cadvisor
- targets: ['192.168.10.11:8080']
  labels:
    instance: test服务器
    job: cadvisor
- targets: ['192.168.10.11:9104']
  labels:
    instance: test服务器
    job: mysql

- targets: ['192.168.10.11:9256']
  labels:
    instance: test服务器
    job: process
Consul 服务发现
Consul 是基于 GO 语言开发的开源工具,主要面向分布式,服务化的系统提供服务注册、服务发现和配置管理的功能。Consul 提供服务注册/发现、健康检查、Key/Value存储、多数据中心和分布式一致性保证等功能。之前我们通过 Prometheus 实现监控,当新增一个 Target 时,需要变更服务器上的配置文件,即使使用 file_sd_configs 配置,也需要登录服务器修改对应 Json 文件,会非常麻烦。不过 Prometheus 官方支持多种自动服务发现的类型,其中就支持 Consul。
官方https://www.consul.io/downloads.html
wget https://releases.hashicorp.com/consul/1.19.0/consul_1.19.0_linux_amd64.zip
unzip consul_1.19.0_linux_amd64.zip
mv consul /usr/local/bin
consul agent -dev -client 0.0.0.0 &
启动Consul
./consul agent -server -bootstrap -bind=0.0.0.0 -client=0.0.0.0 -data-dir=data -ui -node=0.0.0.0 &
consul启动参数介绍
-server :定义agent运行在server模式
-bootstrap-expect :在一个datacenter中期望提供的server节点数目,当该值提供的时候,consul一直等到达到指定sever数目的时候才会引导整个集群,该标记不能和bootstrap共用
-data-dir:提供一个目录用来存放agent的状态,所有的agent允许都需要该目录,该目录必须是稳定的,系统重启后都继续存在
-node:节点在集群中的名称,在一个集群中必须是唯一的,默认是该节点的主机名
-bind:该地址用来在集群内部的通讯,集群内的所有节点到地址都必须是可达的,默认是0.0.0.0
-ui:启动web界面
-config-dir:配置文件目录,里面所有以.json结尾的文件都会被加载
-rejoin:使consul忽略先前的离开,在再次启动后仍旧尝试加入集群中。
-client:consul服务侦听地址,这个地址提供HTTP、DNS、RPC等服务,默认是127.0.0.1所以不对外提供服务,如果你要对外提供服务改成0.0.0.0
curl -X PUT -d '{"id": "node1","name": "node-exporter","address": "192.168.10.11","port": 9100,"tags": ["exporter"],"meta": {"job": "node_exporter","instance": "test服务器"},"checks": [{"http": "http://192.168.10.11:9100/metrics", "interval": "5s"}]}' http://192.168.10.11:8500/v1/agent/service/register命令解释:
-X PUT:使用 PUT 方法发送请求。在这个命令中,PUT 方法用于注册服务到 Consul。
-d '{"id": "node1","name": "node_exporter","address": "node_exporter","port": 9100,"tags": ["exporter"],"meta": {"job": "node_exporter","instance": "Prometheus服务器"},"checks": [{"http": "http://192.168.1.144:9100/metrics", "interval": "5s"}]}':指定要发送的数据体,即要注册的服务的信息。这里使用 JSON 格式进行定义。
"id": "node1":服务的唯一标识符。
"name": "node_exporter":服务的名称。
"address": "node_exporter":服务的地址。
"port": 9100:服务的端口号。
"tags": ["exporter"]:服务的标签,可以是任意字符串数组。
"meta": {"job": "node_exporter","instance": "Prometheus服务器"}:附加的元数据信息,可以是任意键值对。
"checks": [{"http": "http://192.168.1.144:9100/metrics", "interval": "5s"}]:与服务相关的健康检查配置。这里定义了一个 HTTP 类型的检查,检查地址为 http://192.168.1.144:9100/metrics,每 5 秒执行一次。
http://localhost:8500/v1/agent/service/register:Consul Agent 的注册服务 API 端点。
将json数据放在文件中使用文件注册
把json数据放在文件中,使用这个json文件注册
mkdir /data/consul
cd /data/consul
cat > node_exporter.json<<"EOF" { "id": "node1", "name": "node_exporter", "address": "192.168.10.11", "port": 9100, "tags": ["exporter"], "meta": { "job": "node_exporter", "instance": "test服务器" }, "checks": [{ "http": "http://192.168.10.11:9100/metrics", "interval": "10s" }] } EOF
使用json文件注册
curl --request PUT --data @node_exporter.json http://localhost:8500/v1/agent/service/register
Prometheus配置
在Prometheus配置Job,这里使用Consul的服务发现方式,并配置好Consul接口地址,用于发现Consul中的node_exporter节点。
cat > prometheus/prometheus.yml<<"EOF"

# 全局配置
global:
  scrape_interval: 15s  # 将搜刮间隔设置为每15秒一次。默认是每1分钟一次
  evaluation_interval: 15s  # 每15秒评估一次规则,默认是每1分钟一次

# Alertmanager 配置
alerting:
  alertmanagers:
  - static_configs:
    - targets: ['localhost:9093']

# 报警(触发器)配置
rule_files:
  - "alert.yml"
  - "rules/*.yml"

# 搜刮配置
scrape_configs:
  - job_name: 'prometheus'
    # 覆盖全局默认值,每15秒从该作业中刮取一次目标
    scrape_interval: 15s
    static_configs:
      - targets: ['localhost:9090']

  - job_name: 'alertmanager'
    # 覆盖全局默认值,每15秒从该作业中刮取一次目标
    scrape_interval: 15s
    static_configs:
      - targets: ['localhost:9093']

  - job_name: 'consul_exporter'
    consul_sd_configs:
      - server: '192.168.10.11:8500'
        services: []
    relabel_configs:
      - source_labels: [__meta_consul_tags]
        regex: .*exporter.*
        action: keep
      - regex: __meta_consul_service_metadata_(.+)
        action: labelmap

EOF
注释 :services 用于过滤Consul服务,如果为空,则会获取全部服务信息。
安装 ConsulManager
从github上下载docker-compose二进制文件安装
下载最新版的docker-compose文件
官方文档地址:Install Docker Compose | Docker Documentation
https://github.com/docker/compose/releases/download/v2.5.0/docker-compose-linux-x86_64添加可执行权限
mv docker-compose-linux-x86_64 /usr/local/bin/docker-compose


docker-compose version


Docker Compose version v2.5.0
2.pip安装
pip install docker-compose基于docker-compose安装
安装 ConsulManager
2.1 下载源码
下载地址  https://github.com/starsliao/ConsulManager/releases
目录结构如下:
consulmanager部署和使用_bc_03

2.2 docker-compose.yml 内容
登录后复制
[root@localhost ConsulManager-0.12.7]# cat docker-compose.yml
version: "3.2"
services:
  flask-consul:
    image: swr.cn-south-1.myhuaweicloud.com/starsl.cn/flask-consul:latest
    container_name: flask-consul
    hostname: flask-consul
    restart: always
    volumes:
      - /usr/share/zoneinfo/PRC:/etc/localtime
    environment:
      consul_token: xxxxx-xxxxx-xxxxx
      consul_url: http://192.168.10.11:8500/v1
      admin_passwd: 123.com #登录密码
      log_level: INFO
  nginx-consul:
    image: swr.cn-south-1.myhuaweicloud.com/starsl.cn/nginx-consul:latest
    container_name: nginx-consul
    hostname: nginx-consul
    restart: always
    ports:
      - "1026:1026"
    volumes:
      - /usr/share/zoneinfo/PRC:/etc/localtime

2.3启动并访问
启动:
docker-compose pull && docker-compose up -d
访问:
http://{IP}:1026,使用配置的变量 admin_passwd 登录
Relabeling机制
在Prometheus所有的Target实例中,都包含一些默认的Metadata标签信息。
默认情况下,当Prometheus加载Target实例完成后,这些Target时候都会包含一些默认的标签:
__address__:当前Target实例的访问地址<host>:<port>__scheme__:采集目标服务访问地址的HTTP Scheme,HTTP或者HTTPS__metrics_path__:采集目标服务访问地址的访问路径__param_<name>:采集任务目标服务的中包含的请求参数
使用replace/labelmap重写标签
Relabeling最基本的应用场景就是基于Target实例中包含的metadata标签,动态的添加或者覆盖标签。例如,通过Consul动态发现的服务实例还会包含以下Metadata标签信息:
__meta_consul_address:consul地址__meta_consul_dc:consul服务所在的数据中心__meta_consulmetadata:服务的metadata__meta_consul_node:consul服务node节点的信息__meta_consul_service_address:服务访问地址__meta_consul_service_id:服务ID__meta_consul_service_port:服务端口__meta_consul_service:服务名称__meta_consul_tags:服务包含的标签信息
promql
.什么是PromQL?
PromQL是Prometheus的标准查询语句,Prometheus 通过指标名称(metrics name)以及对应的一组标签(labelset)唯一定义一条时间序列。指标名称反映了监控样本的基本标识,而 label 则在这个基本特征上为采集到的数据提供了多种特征维度。用户可以基于这些特征维度过滤,聚合,统计从而产生新的计算后的一条时间序列。
Prometheus 提供内置 PromQL 功能查询语言,提供对时间序列数据丰富的查询,聚合以及逻辑运算能力的支持。使用户可以实时选择和汇总时间序列数据。表达式的结果可以显示为图形,可以在 Prometheus 的表达式浏览器中显示为表格数据,也可以由外部系统通过 HTTP API 使用。
在 Prometheus 的表达语言中,一个表达式或子表达式可以计算为以下四种类型之一: 瞬时向量(Instant vector):它是指在同一时刻,抓取所有度量指标数据。这些度量指标数据的key都是相同的,也就是相同的时间戳. 范围向量(Range vector):它是指在任何一个时间范围内,抓取所有度量指标数据. 标量(Scalar):一个简单的数字浮点值。 字符串(String):一个未被使用的简单字符串值. 注意:根据表达式的不同,得出的图像也是有范围性的。例如仪表盘的数据只能显示瞬时向量。
PromQL的类型有哪些?
这就要看需要具体的需求了。
监控一般做为组件和系统的健康状态存在,所以最常用的就是实时数据/瞬时数据类型。
在统计数据中累计个数,就会有累加类型。
想分析大量数据的分布情况,会用到其他两种类型,具体如下。
promql基本使用
在 Prometheus 的表达式语言中,表达式或子表达式包括以下四种类型之一:
瞬时向量(Instant vector) - 一组时间序列,每个时间序列包含单个样本,它们共享相同的时间戳。也就是说,表达式的返回值中只会包含该时间序列中的最新的一个样本值。而相应的这样的表达式称之为瞬时向量表达式。
区间向量(Range vector) - 一组时间序列,每个时间序列包含一段时间范围内的样本数据。
标量(Scalar) - 一个浮点型的数据值。
字符串(String) - 一个简单的字符串值。
瞬时向量选择器
瞬时向量选择器用来选择一组时序在某个采样点的采样值。最简单的情况就是指定一个度量指标,选择出所有属于该度量指标的时序的当前采样值。比如下面的表达式:
node_memory_Active_bytes区间向量选择器
区间向量选择器类似于瞬时向量选择器,不同的是它选择的是过去一段时间的采样值。可以通过在瞬时向量选择器后面添加包含在 [] 里的时长来得到区间向量选择器。比如下面的表达式选出了所有度量指标为node_memory_Active_bytes且resource是pod的时序在过去1 分钟的采样值。
node_memory_Active_bytes[1m]时长的单位可以是下面几种之一:
s:seconds
m:minutes
h:hours
d:days
w:weeks
y:years
标量
就是纯数字计算,没有时序
1024*104
字符串不常用
时间序列过滤器
瞬时向量
可以通过在后面添加用大括号包围起来的一组标签键值对来对时序进行过滤。比如下面的表达式筛选出了 job 为 kubernetes-apiservers,并且 resource为 pod的时序:
node_memory_Active_bytes{instance="prometheus服务器"}匹配标签值时可以是等于,也可以使用正则表达式。总共有下面几种匹配操作符:
=:完全相等
!=: 不相等
=~: 正则表达式匹配
!~: 正则表达式不匹配

# 下面的表达式筛选出了container是kube-scheduler或kube-proxy或kube-apiserver的时序数据
container_processes{container=~"kube-scheduler|kube-proxy|kube-apiserver"}
区间向量
区间向量选择器类似于瞬时向量选择器,不同的是它选择的是过去一段时间的采样值。可以通过在瞬时向量选择器后面添加包含在 [] 里的时长来得到区间向量选择器。比如下面的表达式选出了所有度量指标为apiserver_request_total且resource是pod的时序在过去1 分钟的采样值。
# 这个不支持Graph,需要选择Console,才会看到采集的数据
node_memory_Active_bytes{instance="prometheus服务器"}[1m]
s - 秒
m - 分钟
h - 小时
d - 天
w - 周
y - 年
偏移向量选择器
前面介绍的选择器默认都是以当前时间为基准时间,偏移修饰器用来调整基准时间,使其往前偏移一段时间。偏移修饰器紧跟在选择器后面,使用 offset 来指定要偏移的量。比如下面的表达式选择度量名称为node_memory_Active_bytes的所有时序在 5 分钟前的采样值。
node_memory_Active_bytes{instance="prometheus服务器"} offset 5m下面的表达式选择apiserver_request_total 度量指标在 1 周前的这个时间点过去 5 分钟的采样值。
node_memory_Active_bytes{instance="prometheus服务器"}[5m] offset 1wpromql二元运算符
二元比较运算
数学运算符:
+ (加法)
- (减法)
* (乘法)
/ (除法)
% (求余)
^ (求幂)
未使用的内存(MiB): (instance_memory_limit_bytes - instance_memory_usage_bytes) / 1024 / 1024
比较运算符:
== (相等)
!= (不相等)
> (大于)
< (小于)
>= (大于等于)
<= (小于
过滤标签job=“apiserver"样本大于10的所有样本数据 : http_requests_total{job=“apiserver”, handler=”/api/comments"}>1
逻辑运算符:
and (并且)
or (或)
unless (除)
PromQL 聚合操作
Prometheus 还提供了聚合操作符,这些操作符作用于瞬时向量。可以将瞬时表达式返回的样本数据进行聚合,形成一个新的时间序列。目前支持的聚合函数有:
sum (求和)
min (最小值)
max (最大值)
avg (平均值)
stddev (标准差)
stdvar (标准方差)
count (计数)
count_values (对value进行计数)
bottomk (后n条时序)
topk (前n条时序)
quantile (分位数)
(1)每台主机 CPU 在最近 5 分钟内的平均使用率
(1 - avg(rate(node_cpu_seconds_total{mode="idle"}[5m])) by (instance)) * 100

(2)查询 1 分钟的 load average 的时间序列是否超过主机 CPU 数量 2 倍
node_load1 > on (instance) 2 * count (node_cpu_seconds_total{mode="idle"}) by (instance)

(3)计算主机内存使用率
可用内存空间:空闲内存、buffer、cache 指标之和
node_memory_MemFree_bytes + node_memory_Buffers_bytes + node_memory_Cached_bytes

已用内存空间:总内存空间减去可用空间
node_memory_MemTotal_bytes - (node_memory_MemFree_bytes + node_memory_Buffers_bytes + node_memory_Cached_bytes)

使用率:已用空间除以总空间
(node_memory_MemTotal_bytes - (node_memory_MemFree_bytes + node_memory_Buffers_bytes + node_memory_Cached_bytes)) / node_memory_MemTotal_bytes * 100

(4)计算所有 node 节点所有容器总计内存:
sum  by (instance) (container_memory_usage_bytes{instance=~"node*"})/1024/1024/1024

(5)计算 node01 节点最近 1m 所有容器 cpu 使用率:
sum (rate(container_cpu_usage_seconds_total{instance="node01"}[1m])) / sum (machine_cpu_cores{instance="node01"}) * 100
#container_cpu_usage_seconds_total 代表容器占用CPU的时间总和

(6)计算最近 5m 每个容器 cpu 使用情况变化率
sum (rate(container_cpu_usage_seconds_total[5m])) by (container_name)

(7)查询 K8S 集群中最近 1m 每个 Pod 的 CPU 使用情况变化率
sum (rate(container_cpu_usage_seconds_total{image!="", pod_name!=""}[1m])) by (pod_name)
#由于查询到的数据都是容器相关的,所以最好按照 Pod 分组聚合
用于对记录的 value 值进行求和。
例如:sum(prometheus_http_requests_total) 表示统计所有 HTTP 请求的次数。
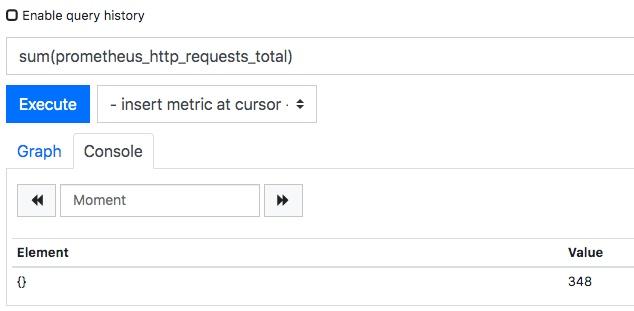
min 最小值
返回所有记录的最小值。
prometheus_http_requests_total 指标所有数据如下图所示:
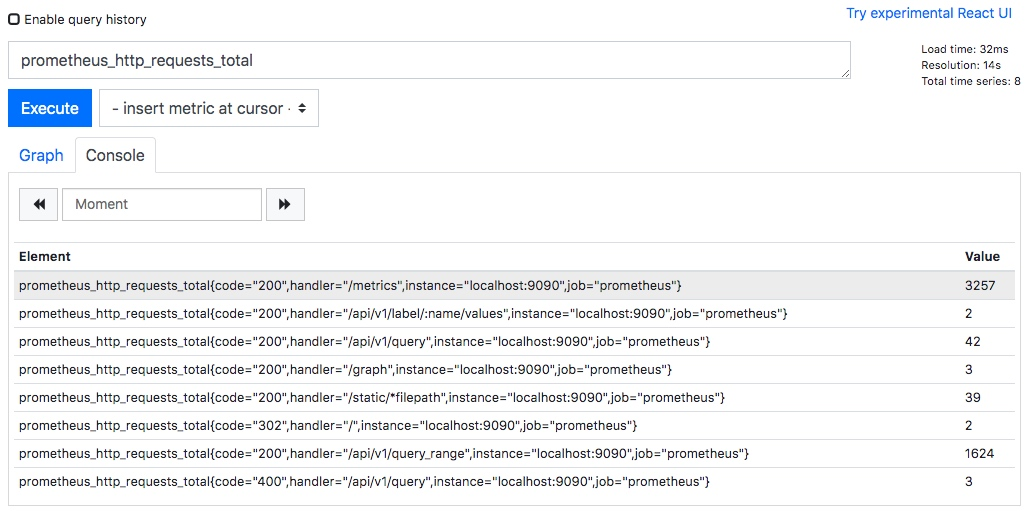
当我们执行如下 PromQL 时,会筛选出最小的记录值。
min(prometheus_http_requests_total)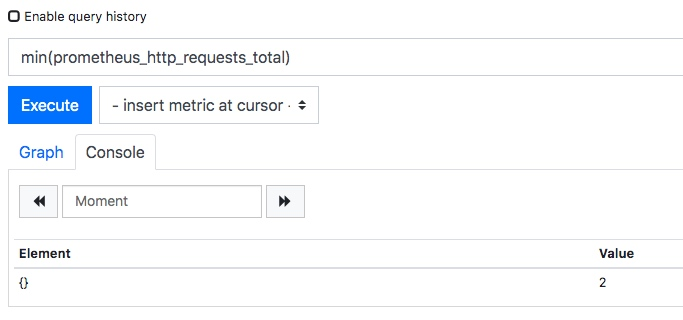
max 最大值
返回所有记录的最大值。
当我们执行如下 PromQL 时,会筛选出最大的记录值。
max(prometheus_http_requests_total)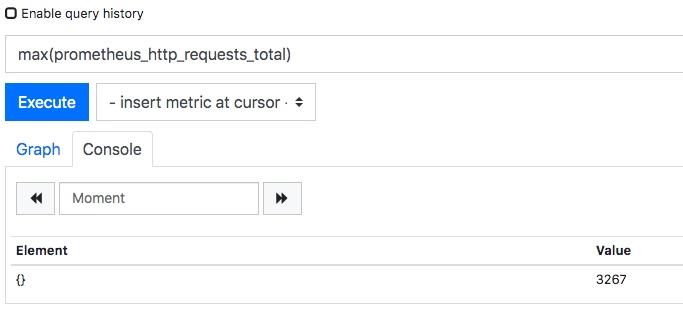
avg 平均值
avg 函数返回所有记录的平均值。
当我们执行如下 PromQL 时,会筛选出最大的记录值。
avg(prometheus_http_requests_total)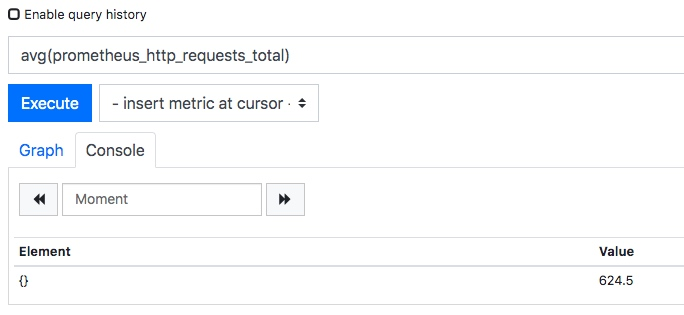
stddev 标准差
标准差(Standard Deviation)常用来描述数据的波动大小。例如我们统计篮球队员身高:

两支队伍平均身高都是 180,看起来似乎差不多。但如果画图的话,得到结果如下:

很显然,蓝色队队员身高更加整齐一些,橙色队身高显得参差不齐。为了反映一组数据,偏离平均值的程度,就有了「标准差 」这个概念。
如果数据量很大,比如几万人的身高,我们不容易从折线图看出来,可以直接用公式计算。上图的数据标准差计算结果为:

很明显,橙色队的标准差比蓝色队标准差大很多。这说明橙色队的身高波动更大。
当我们执行如下 PromQL 时,会计算出不同 HTTP 请求的数量波动情况。
stddev(prometheus_http_requests_total)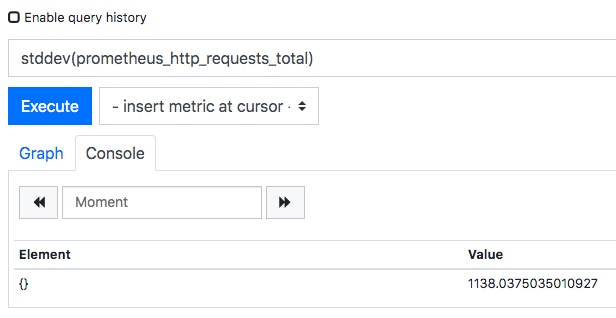
从计算结果可以看到,标准差达到了 1100 多,这说明其数据波动非常大。
count 计数
count 函数返回所有记录的计数。
例如:count(prometheus_http_requests_total) 表示统计所有 HTTP 请求的次数。
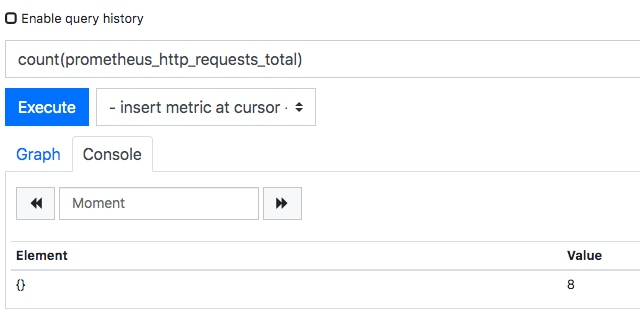
bottomk 后几条
bottomk 用于对样本值进行排序,返回当前样本值后 N 位的时间序列。
例如获取 HTTP 请求量后 5 位的请求,可以使用表达式:
bottomk(5, prometheus_http_requests_total)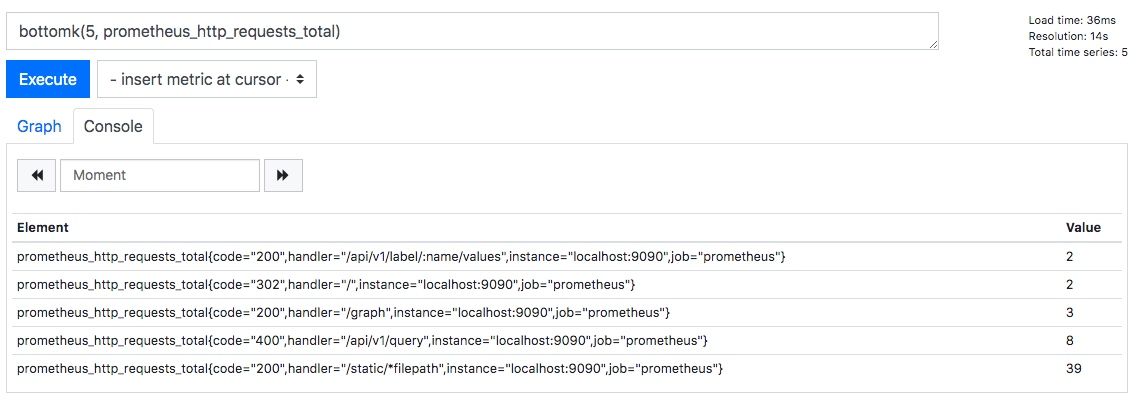
topk 前几条
topk 用于对样本值进行排序,返回当前样本值前 N 位的时间序列。
例如获取 HTTP 请求量前 5 位的请求,可以使用表达式:
topk(5, prometheus_http_requests_total)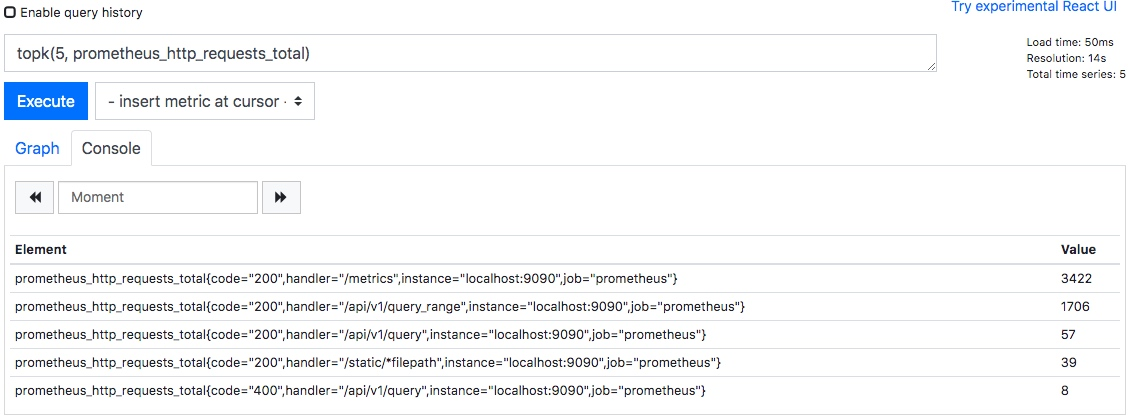
alertmanager
1、简述:
Alertmanager是一个独立的告警模块,接收Prometheus等客户端发来的警报,之后通过分组、删除重复等处理,并将它们通过路由发送给正确的接收器。Prometheus的警报分为两个部分。Prometheus服务器中的警报规则将警报发送到Alertmanager。该Alertmanager 然后管理这些警报,包括沉默,抑制,聚集和通过的方法,如电子邮件发出通知,对呼叫通知系统,以及即时通讯平台。
2、使用步骤:
\1. 部署Alertmanager
\2. 配置告警接收人
\3. 配置Prometheus与Alertmanager通信
\4. 在Prometheus中创建告警规则
3、工作机制
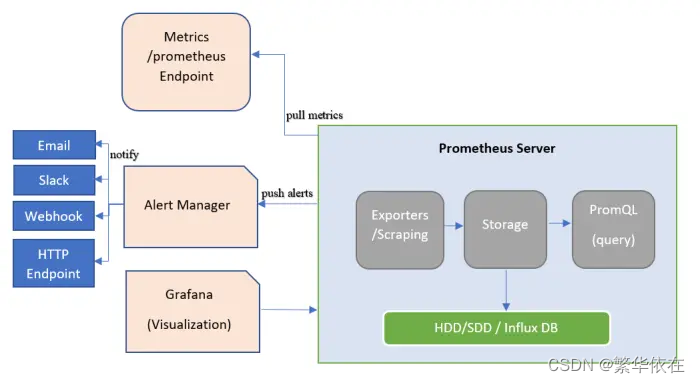
Prometheus发出告警时分为两个部分。Prometheus服务器按告警规则(rule_files配置块)将警报发送到Alertmanager(即告警规则是在Prometheus上定义的)。然后,由Alertmanager 来管理这些警报,包括去重(Deduplicating)、分组(Grouping)、沉默(silencing),抑制(inhibition),聚合(aggregation),最终通过电子邮件发出通知,对呼叫通知系统,以及即时通讯平台,将告警通知路由(route)给对应的联系人。
4、设置警报和通知的主要步骤是:
设置和配置 Alertmanager
配置Prometheus与Alertmanager对话
在Prometheus中创建警报规则
5、AlertManager的4个概念
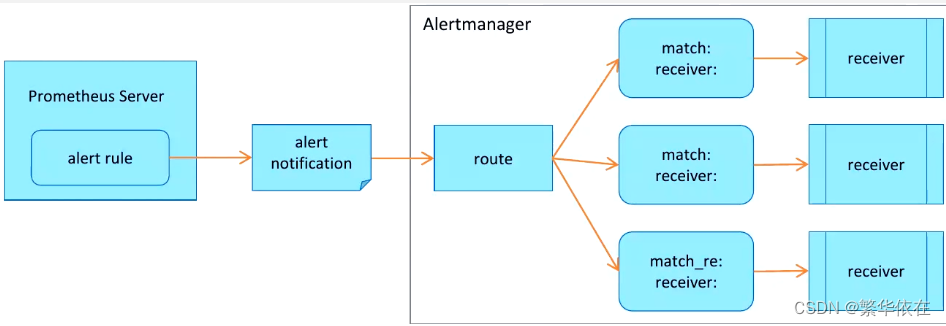
(1)分组(Grouping)
Grouping 是 Alertmanager 把同类型的警报进行分组,合并多条警报到一个通知中。在生产环境中,特别是云环境下的业务之间密集耦合时,若出现多台 Instance 故障,可能会导致成千上百条警报触发。在这种情况下使用分组机制,可以把这些被触发的警报合并为一个警报进行通知,从而避免瞬间突发性的接受大量警报通知,使得管理员无法对问题进行快速定位。
(2)抑制(Inhibition)
Inhibition 是 当某条警报已经发送,停止重复发送由此警报引发的其他异常或故障的警报机制。
在生产环境中,IDC托管机柜中,若每一个机柜接入层仅仅是单台交换机,那么该机柜接入交换机故障会造成机柜中服务器非 up 状态警报。再有服务器上部署的应用服务不可访问也会触发警报。
这时候,可以通过在 Alertmanager 配置忽略由于交换机故障而造成的此机柜中的所有服务器及其应用不可达而产生的警报。
在我们的灾备体系中,当原有集群故障宕机业务彻底无法访问的时候,会把用户流量切换到备份集群中,这样为故障集群及其提供的各个微服务状态发送警报机会失去了意义,此时, Alertmanager 的抑制特性就可以在一定程度上避免管理员收到过多无用的警报通知。
(3)静默(Silences )
Silences 提供了一个简单的机制,根据标签快速对警报进行静默处理;对传进来的警报进行匹配检查,如果接受到警报符合静默的配置,Alertmanager 则不会发送警报通知。
以上除了分组、抑制是在 Alertmanager 配置文件中配置,静默是需要在 WEB UI 界面中设置临时屏蔽指定的警报通知。
(4)路由(route)
用于配置 Alertmanager 如何处理传入的特定类型的告警通知,其基本逻辑是根据路由匹配规则的匹配结果来确定处理当前报警通知的路径和行为
以上的概念需要好好理解,这样才可以轻松的在监控系统设计的时候针对警报设计的一些场景自行调整。
6、Alert 的三种状态:
pending:警报被激活,但是低于配置的持续时间。这里的持续时间即rule里的FOR字段设置的时间。改状态下不发送报警。
firing:警报已被激活,而且超出设置的持续时间。该状态下发送报警。
inactive:既不是pending也不是firing的时候状态变为inactive
7、prometheus触发一条告警的过程:
prometheus—>触发阈值—>超出持续时间—>alertmanager—>分组|抑制|静默—>媒体类型—>邮件|钉钉|微信等。
安装部署
看上面安装
邮件报警
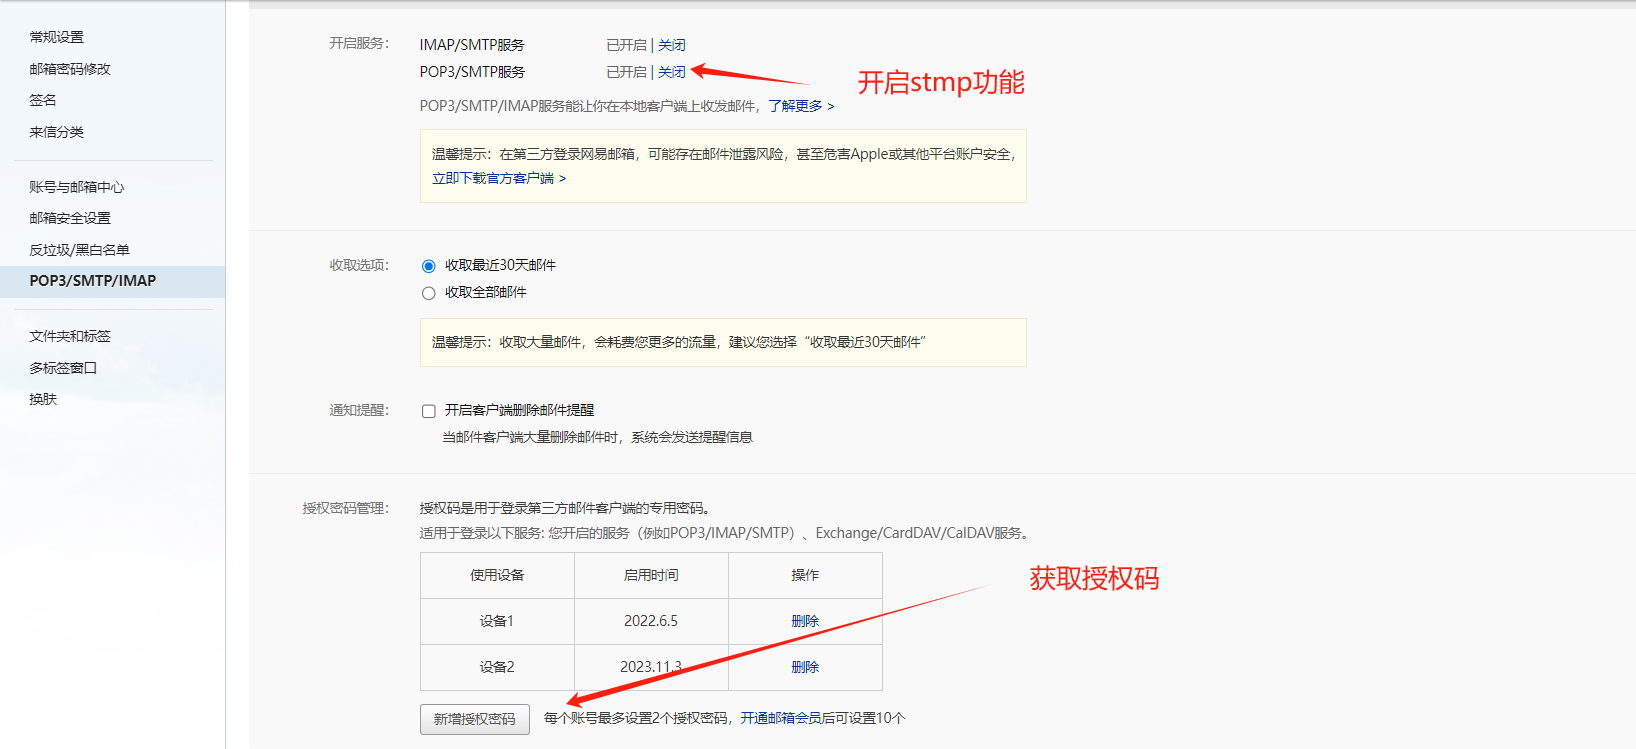
那么,我们就来配置一下使用 Email 方式通知报警信息,这里以 163邮箱为例,配置如下:
# global:全局配置,主要配置告警方式,如邮件、webhook等。
global:
  resolve_timeout: 5m  # resolve_timeout:解析超时时间
  smtp_smarthost: 'smtp.163.com:465' # 这里为 139 邮箱 SMTP 服务地址,同时要设置开启 POP3/SMTP 服务。
  smtp_from: 'anygts@163.com'   # smtp_from:邮件发送者的邮箱地址
  smtp_auth_username: 'anygts@163.com'(发邮箱)   # 发邮件的邮箱用户名
  smtp_auth_password: 'LOHUYHJMDTBDNIHO'(IMAP的授权码)  # smtp_auth_password:SMTP服务的密码 为授权码。非邮箱密码
  smtp_require_tls: false   # smtp_require_tls:是否启用tls

# 模板 (非必须,默认即可)
templates:
- '/opt/prometheus/alertmanager/templates/email.tmpl'

# route:用来设置报警的分发策略。Prometheus的告警先是到达alertmanager的根路由(route),alertmanager的根路由不能包含任何匹配项,因为根路由是所有告警的入口点。
# 另外,根路由需要配置一个接收器(receiver),用来处理那些没有匹配到任何子路由的告警(如果没有配置子路由,则全部由根路由发送告警)
# 接收器。告警进入到根route后开始遍历子route节点,如果匹配到,则将告警发送到该子route定义的receiver中,然后就停止匹配了。因为在route中 continue默认为false,如果continue为true,则告警会继续进行后续子route匹配。如果当前告警仍匹配不到任何的子route,则该告警将从其上一级(匹配)route或者根route发出(按最后匹配到的规则发出邮件)

route:
  group_by: ['alertname']  # group_by:采用哪个标签作为分组的依据
  group_wait: 30s          # group_wait:分组等待的时间
  group_interval: 5m       # group_interval:上下两组发送告警的间隔时间
  repeat_interval: 1h      # repeat_interval:# 告警通知成功发送后,若问题一直未恢复,需再次重复发送的间隔。默认1h
  receiver: 'email'     #  配置告警消息接收者,与下面配置的对应。例如常用的 email、wechat

-------
  routes:    # 子路由
  - receiver: 'wechat'
    match:    # 通过标签去匹配这次告警是否符合这个路由节点;也可以使用  match_re 进行正则匹配
      severity: Disaster    # 标签severity为Disaster时满足条件,使用wechat警报
----------

receivers:  # 配置报警信息接收者信息。
- name: 'email'  # 警报接收者名称
  email_configs:
  - to: '2797467369@qq.com'(收邮箱)# 接收警报的email
    html: '{{ template "email.html" .}}' # 发送邮件的内容(调用模板文件中的)
    headers:  # 邮件标题,不设定使用默认的即可
      Subject: '告警信息'
    send_resolved: true        # 故障恢复后通知

- name: 'wechat'
  wechat_configs:
  - corp_id: xxxxx        # 企业信息("我的企业"--->"CorpID"[在底部])
    to_user: '@all'        # 发送给企业微信用户的ID,这里是所有人
    agent_id: xxxxx    # 企业微信("企业应用"-->"自定应用"[Prometheus]--> "AgentId")
    api_secret: DY9IlG0Bdwawb_ku0NblxKFrrmMwbLIZ7YxMa5rCg8g        # 企业微信("企业应用"-->"自定应用"[Prometheus]--> "Secret")
    send_resolved: true         # 故障恢复后通知


# 抑制规则,用于定义哪些告警在触发时不应再触发其他告警。
inhibit_rules:
  - source_match:   # 定义了触发抑制规则的源告警的条件。只有当源告警满足这些条件时,抑制规则才会被触发。
      # 这里定义了源告警的severity 标签值必须为'critical'。换句话说,只有当告警的严重程度为 "critical" 时,才考虑应用抑制规则。
      severity: 'critical'
    # target_match 定义了被抑制的目标告警的条件。当源告警触发时,任何满足这些条件的目标告警都将被抑制,即不会被发送。
    target_match:
      # 这里定义了目标告警的severity 标签值必须为 'warning'。因此,当有一个 "critical" 告警触发时,所有同时触发的 "warning" 告警将被抑制。
      severity: 'warning'
    # 字段定义了一组标签,源告警和目标告警在这些标签上的值必须相同,抑制规则才会被应用。
    equal: ['alertname', 'dev', 'instance']


----------
举个例子,假设有以下两个告警:
一个 "critical" 级别的告警,标签为 alertname: server-down, dev: server1, instance: ip-192.168.1.1。
一个 "warning" 级别的告警,标签也为 alertname: server-down, dev: server1, instance: ip-192.168.1.1。
由于这两个告警在 alertname、dev 和 instance 标签上的值相同,并且源告警的 severity 是 "critical",目标告警的 severity 是 "warning",因此 "warning" 级别的告警将被抑制,不会被发送。


-----------
# 修改好配置文件后,可以使用amtool工具检查配置
[root@localhost conf]# ../bin/amtool check-config alertmanager.yml
Checking 'alertmanager.yml'  SUCCESS
Found:
 - global config
 - route
 - 1 inhibit rules
 - 1 receivers
 - 0 templates

#重载下alert manager配置
[root@rabbitmq_2 prometheus]# curl -X POST http://localhost:9093/-/reload
global:
resolve_timeout: 5m # resolve_timeout:解析超时时间
smtp_smarthost: 'smtp.163.com:465' # 这里为 139 邮箱 SMTP 服务地址,同时要设置开启 POP3/SMTP 服务。
smtp_from: 'anygts@163.com' # smtp_from:邮件发送者的邮箱地址
smtp_auth_username: 'anygts@163.com' # 发邮件的邮箱用户名
smtp_auth_password: 'LOHUYHJMDTBDNIHO' # smtp_auth_password:SMTP服务的密码 为授权码。非邮箱密码
smtp_require_tls: false # smtp_require_tls:是否启用tls
route:
group_by: ['alertname'] # group_by:采用哪个标签作为分组的依据
group_wait: 30s # group_wait:分组等待的时间
group_interval: 5m # group_interval:上下两组发送告警的间隔时间
repeat_interval: 1h # repeat_interval:# 告警通知成功发送后,若问题一直未恢复,需再次重复发送的间隔。默认1h
receiver: 'email' # 配置告警消息接收者,与下面配置的对应。例如常用的 email、wechat
templates:
- '/usr/local/alertmanager/templates/*.tmpl'
receivers: # 配置报警信息接收者信息。
- name: 'email' # 警报接收者名称
email_configs:
- to: '2797467369@qq.com' #(收邮箱)# 接收警报的email
html: '{{ template "email.html" .}}' # 发送邮件的内容(调用模板文件中的)
headers: # 邮件标题,不设定使用默认的即可
Subject: '告警信息'
send_resolved: true # 故障恢复后通知
inhibit_rules:
- source_match:
severity: 'critical'
target_match:
severity: 'warning'
equal: ['alertname', 'dev', 'instance']以上配置我反复试验后,发现不同的环境参数配置也不一样,调试期间出现了各种报错问题,将其中几个关键的配置说明一下:
smtp_smarthost: 这里为 QQ 邮箱 SMTP 服务地址,官方地址为smtp.qq.com端口为465或587,同时要设置开启POP3/SMTP服务。smtp_auth_password: 这里为第三方登录 QQ 邮箱的授权码,非 QQ 账户登录密码,否则会报错,获取方式在 QQ 邮箱服务端设置开启POP3/SMTP服务时会提示。smtp_require_tls: 是否使用 tls,根据环境不同,来选择开启和关闭。如果提示报错email.loginAuth failed: 530 Must issue a STARTTLS command first,那么就需要设置为 true。着重说明一下,如果开启了 tls,提示报错starttls failed: x509: certificate signed by unknown authority,需要在email_configs下配置insecure_skip_verify: true来跳过 tls 验证。
创建邮件模板
mkdir -pv /usr/local/alertmanager/templates
[root@rabbitmq_2 prometheus]# cd /usr/local/alertmanager/templates
[root@rabbitmq_2 prometheus]# vim eamil.tmpl

{{ define "email.html" }}
{{- if gt (len .Alerts.Firing) 0 -}}{{ range .Alerts }}
<h2>@告警通知</h2>
告警程序: prometheus_alert <br>
告警级别: {{ .Labels.severity }} 级 <br>
告警类型: {{ .Labels.alertname }} <br>
故障主机: {{ .Labels.instance }} <br>
告警主题: {{ .Annotations.summary }} <br>
告警详情: {{ .Annotations.description }} <br>
触发时间: {{ .StartsAt.Local.Format "2006-01-02 15:04:05" }} <br>
{{ end }}{{ end -}}

{{- if gt (len .Alerts.Resolved) 0 -}}{{ range .Alerts }}
<h2>@告警恢复</h2>
告警程序: prometheus_alert <br>
故障主机: {{ .Labels.instance }}<br>
故障主题: {{ .Annotations.summary }}<br>
告警详情: {{ .Annotations.description }}<br>
告警时间: {{ .StartsAt.Local.Format "2006-01-02 15:04:05" }}<br>
恢复时间: {{ .EndsAt.Local.Format "2006-01-02 15:04:05" }}<br>
{{ end }}{{ end -}}
{{- end }}
钉钉报警
安装钉钉告警插件
Prometheus 的Alertmanager自身不支持钉钉报警,需要通过插件的方式来达到报警条件。
1,下载prometheus-webhook-dingtalk
wget https://github.com/timonwong/prometheus-webhook-dingtalk/releases/download/v2.1.0/prometheus-webhook-dingtalk-2.1.0.linux-amd64.tar.gz

tar -xvf prometheus-webhook-dingtalk-2.1.0.linux-amd64.tar.gz  -C  /usr/local/

cd /usr/local

mv prometheus-webhook-dingtalk-2.1.0.linux-amd64/ prometheus-webhook-dingtalk
2,配置钉钉报警模板文件
mkdir -p /usr/local/prometheus-webhook-dingtalk/contrib/templates

vim /usr/local/prometheus-webhook-dingtalk/contrib/templates/dingding.tmpl


{{ define "__subject" }}
[{{ .Status | toUpper }}{{ if eq .Status "firing" }}:{{ .Alerts.Firing | len }}{{ end }}]
{{ end }}


{{ define "__alert_list" }}{{ range . }}
---
    **告警类型**: {{ .Labels.alertname }}
    **告警级别**: {{ .Labels.severity }}
    **故障主机**: {{ .Labels.instance }}
    **告警信息**: {{ .Annotations.description }}
    **触发时间**: {{ (.StartsAt.Add 28800e9).Format "2006-01-02 15:04:05" }}
{{ end }}{{ end }}

{{ define "__resolved_list" }}{{ range . }}
---
    **告警类型**: {{ .Labels.alertname }}
    **告警级别**: {{ .Labels.severity }}
    **故障主机**: {{ .Labels.instance }}
    **触发时间**: {{ (.StartsAt.Add 28800e9).Format "2006-01-02 15:04:05" }}
    **恢复时间**: {{ (.EndsAt.Add 28800e9).Format "2006-01-02 15:04:05" }}
{{ end }}{{ end }}


{{ define "ops.title" }}
{{ template "__subject" . }}
{{ end }}

{{ define "ops.content" }}
{{ if gt (len .Alerts.Firing) 0 }}
**====侦测到{{ .Alerts.Firing | len  }}个故障====**
{{ template "__alert_list" .Alerts.Firing }}
---
{{ end }}

{{ if gt (len .Alerts.Resolved) 0 }}
**====恢复{{ .Alerts.Resolved | len  }}个故障====**
{{ template "__resolved_list" .Alerts.Resolved }}
{{ end }}
{{ end }}

{{ define "ops.link.title" }}{{ template "ops.title" . }}{{ end }}
{{ define "ops.link.content" }}{{ template "ops.content" . }}{{ end }}
{{ template "ops.title" . }}
{{ template "ops.content" . }}
alertmanager配置
global:
  resolve_timeout: 5m  # resolve_timeout:解析超时时间
  smtp_smarthost: 'smtp.163.com:465' # 这里为 139 邮箱 SMTP 服务地址,同时要设置开启 POP3/SMTP 服务。
  smtp_from: 'anygts@163.com'   # smtp_from:邮件发送者的邮箱地址
  smtp_auth_username: 'anygts@163.com'   # 发邮件的邮箱用户名
  smtp_auth_password: 'LOHUYHJMDTBDNIHO' # smtp_auth_password:SMTP服务的密码 为授权码。非邮箱密码
  smtp_require_tls: false   # smtp_require_tls:是否启用tls
route:
  group_by: ['alertname']  # group_by:采用哪个标签作为分组的依据
  group_wait: 30s          # group_wait:分组等待的时间
  group_interval: 5m       # group_interval:上下两组发送告警的间隔时间
  repeat_interval: 1h      # repeat_interval:# 告警通知成功发送后,若问题一直未恢复,需再次重复发送的间隔。默认1h
  receiver: 'webhook'          ####添加1

templates:
- '/usr/local/alertmanager/templates/*.tmpl'

receivers:  # 配置报警信息接收者信息。
- name: 'email'  # 警报接收者名称
  email_configs:
  - to: '2797467369@qq.com' #(收邮箱)# 接收警报的email
    html: '{{ template "email.html" .}}' # 发送邮件的内容(调用模板文件中的)
    headers:  # 邮件标题,不设定使用默认的即可
      Subject: '告警信息'
    send_resolved: true        # 故障恢复后通知

- name: 'webhook'
  webhook_configs:
  - url: http://192.168.10.10:8060/dingtalk/webhook1/send        ######添加2
    send_resolved: true

inhibit_rules:
  - source_match:   # 定义了触发抑制规则的源告警的条件。只有当源告警满足这些条件时,抑制规则才会被触发。
      # 这里定义了源告警的severity 标签值必须为'critical'。换句话说,只有当告警的严重程度为 "critical" 时,才考虑应用抑制规则。
      severity: 'critical'
    target_match:
      severity: 'warning'
    equal: ['alertname', 'dev', 'instance']
3,钉钉插件告警配置
打开钉钉,在群中添加自定义机器人
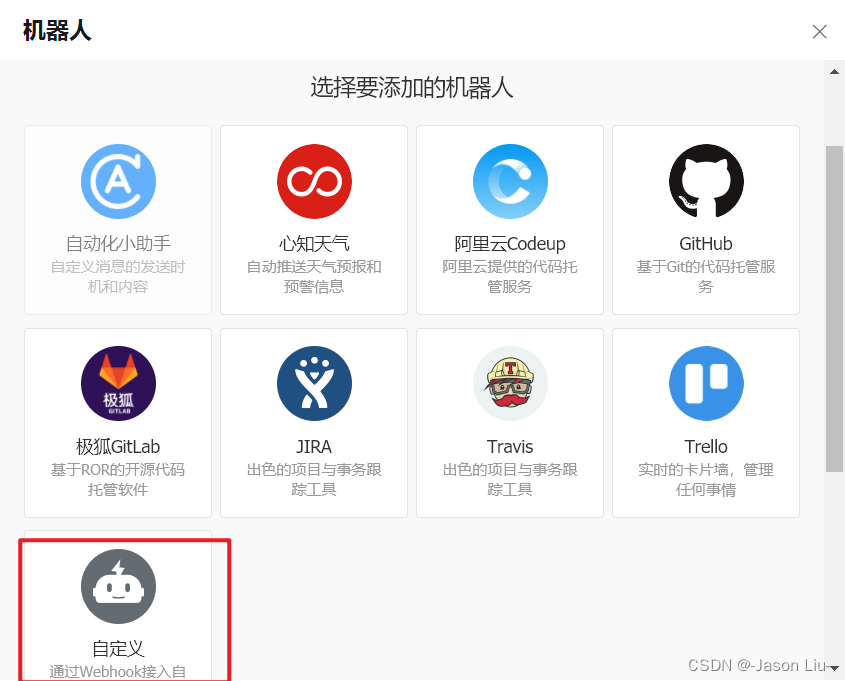
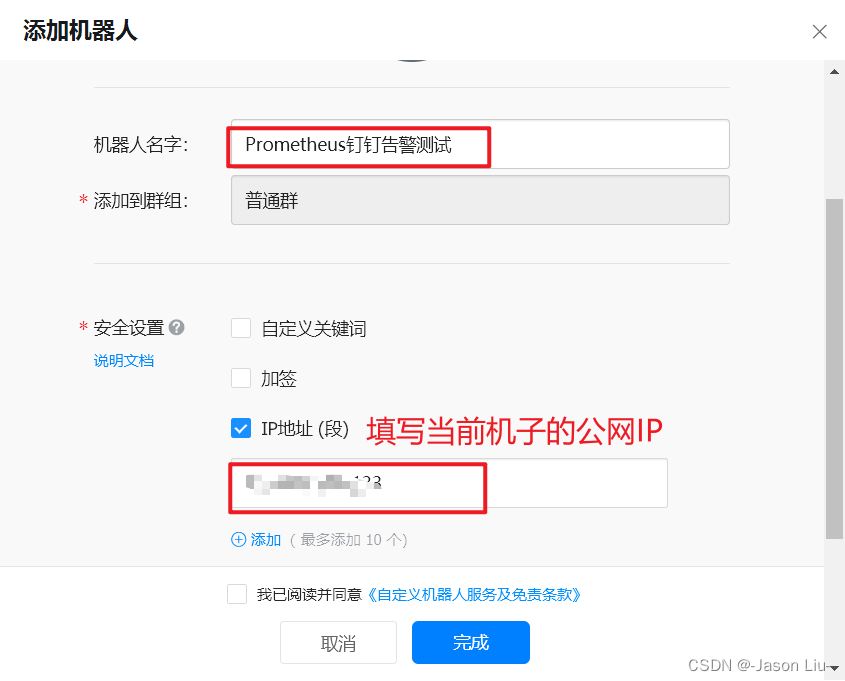
上面的公网IP可以在当前的机子上通过 curl cip.cc查看
复制Webhook

4,拷贝钉钉插件配置文件
cd /usr/local/prometheus-webhook-dingtalk
cp config.example.yml config.yml
4,编辑钉钉插件配置文件
vim config.yml
1修改对应内容,url为复制的Webhook地址
templates:
    - contrib/templates/dingding.tmpl
targets:
  webhook1:
    url: https://oapi.dingtalk.com/robot/send?access_token=12aeeb74d10a7cc5357bd036b968f0b7f7392a8aa0da0a01ac45d7d2922e08fc
#    message:
#      title: '{{ template "ops.title" . }}'
#      text: '{{ template "ops.content" . }}'
5,配置systemctl启动钉钉插件
vim /usr/lib/systemd/system/webhook-dingtalk.service
[Unit]
Description=prometheus-webhook-dingtalk
Documentation=https://github.com/timonwong/prometheus-webhook-dingtalk
After=network.target

[Service]
User=root
Group=root
ExecStart=/usr/local/prometheus-webhook-dingtalk/prometheus-webhook-dingtalk  --config.file=/usr/local/prometheus-webhook-dingtalk/config.yml
ExecReload=/bin/kill -HUP $MAINPID
KillMode=process
Restart=on-failure

[Install]
WantedBy=multi-user.target
6,启动webhook-dingtalk方式一:
systemctl daemon-reload

systemctl restart webhook-dingtalk && systemctl enable webhook-dingtalk

1234
查看webhook-dingtalk启动状态
systemctl status webhook-dingtalk
1
7,启动webhook-dingtalk方式二:
cd /usr/local/prometheus-webhook-dingtalk
1
./prometheus-webhook-dingtalk --config.file=config.yml >dingtalk.log 2>&1 &
1
查看webhook-dingtalk启动状态
tail -f -n 30 dingtalk.log
1
8,prometheus-webhook-dingtalk(默认监听8060端口)
ss -auntlp | grep  8060
1
9,Prometheus 钉钉告警测试
systemctl stop chronyd